I understand horse racing is a controversial topic… that is not the point of this question. Due to incidents where horses suffered life threatening musculoskeletal injuries during races a lot of interest in employing various policies to reduce these events and even Congressional policy have been implemented. The metrics they use for success are measuring the fatality rate per 1000 race starts yearly and now on a quarterly basis. In comparing raw data year to year for a rare event they are mainly looking at noise in my opinion… would a five year moving average be a better metric?
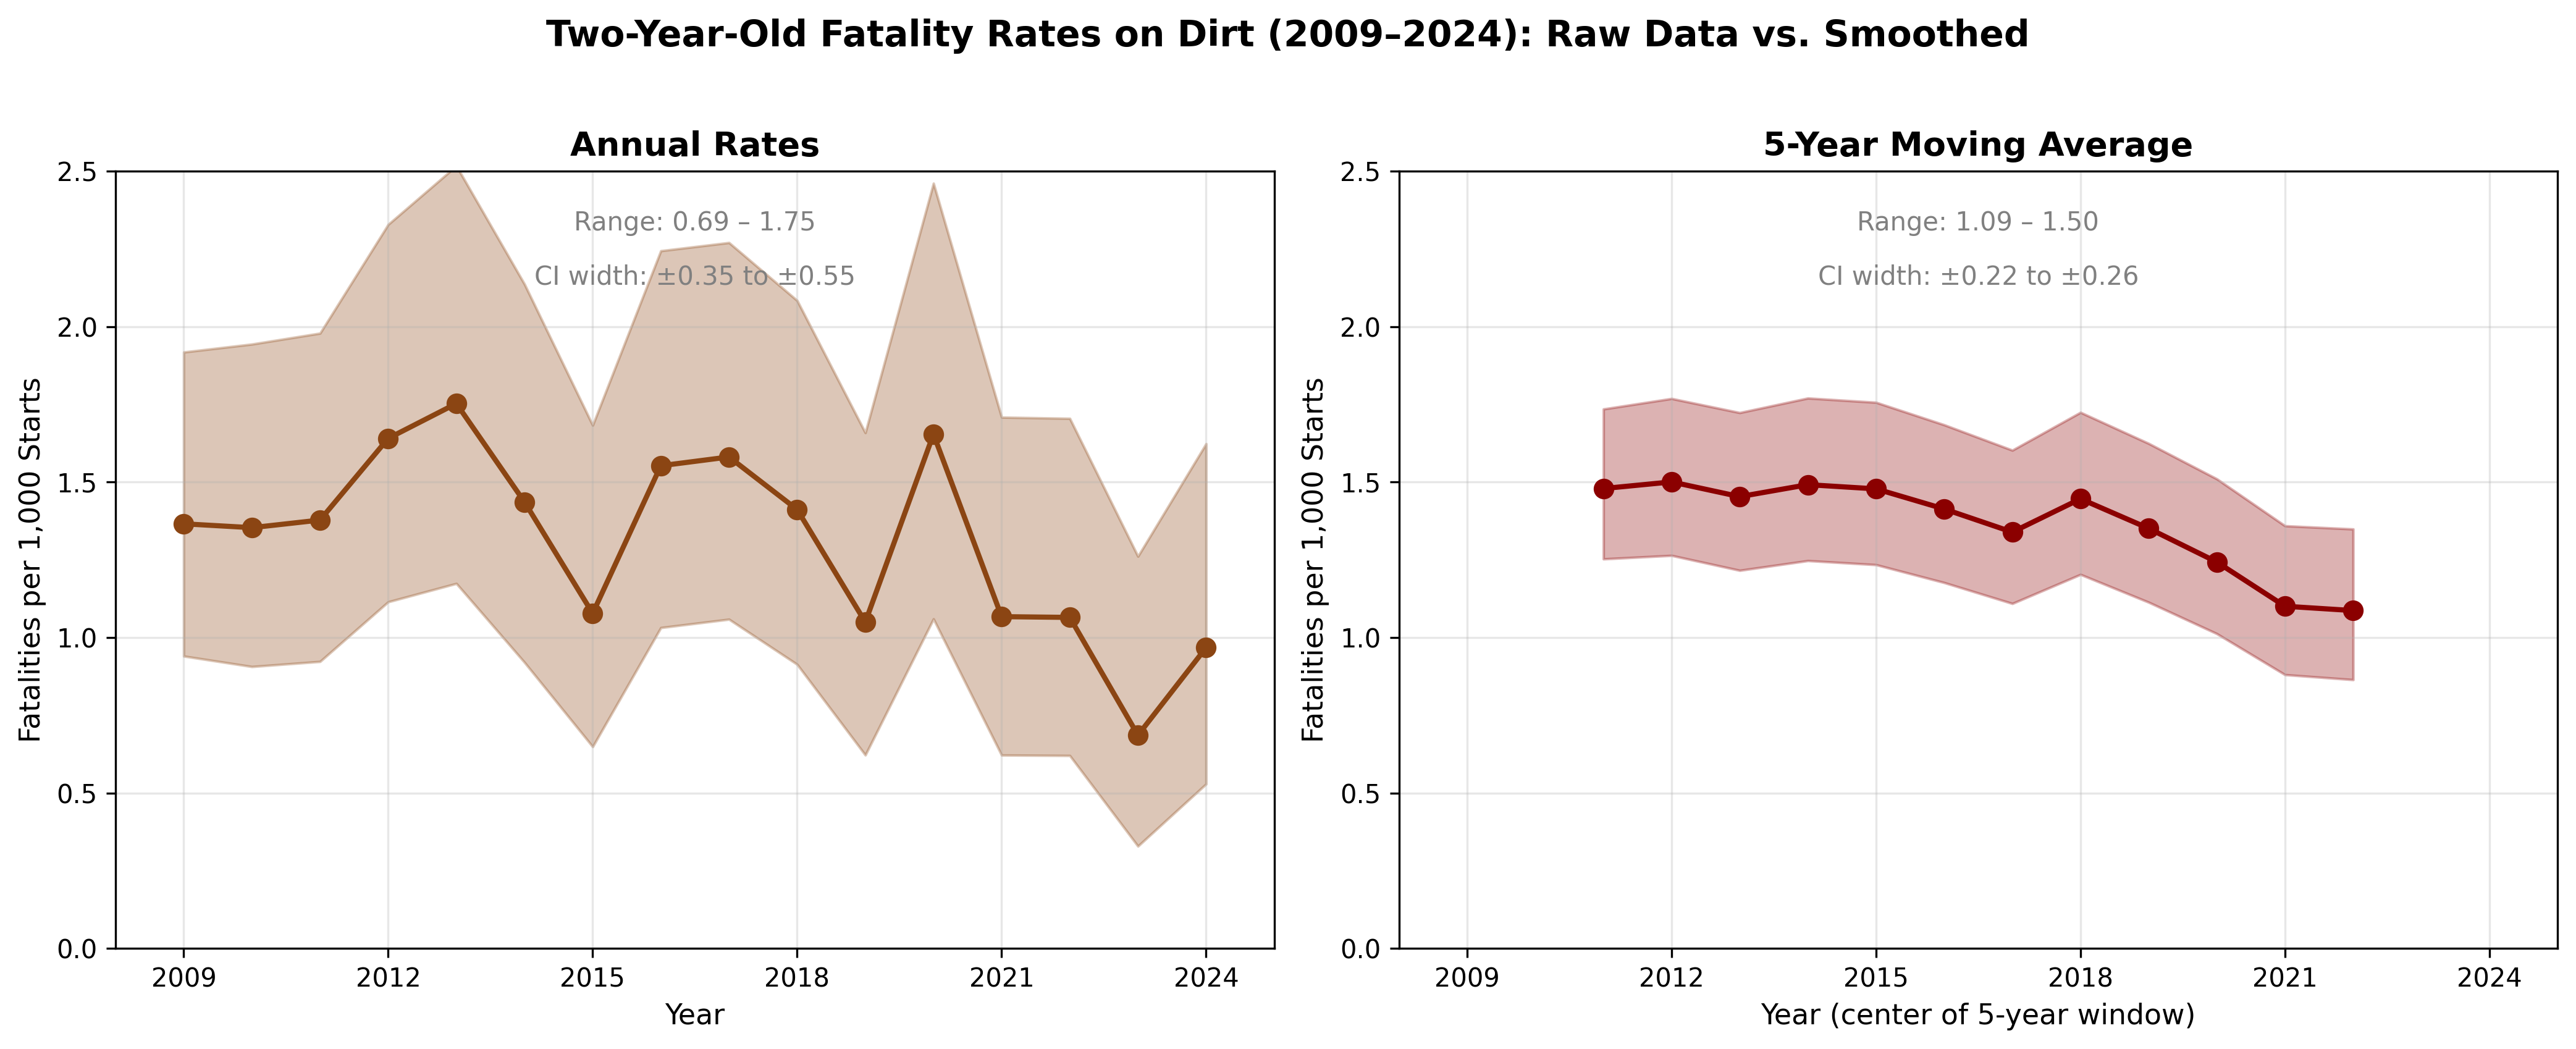
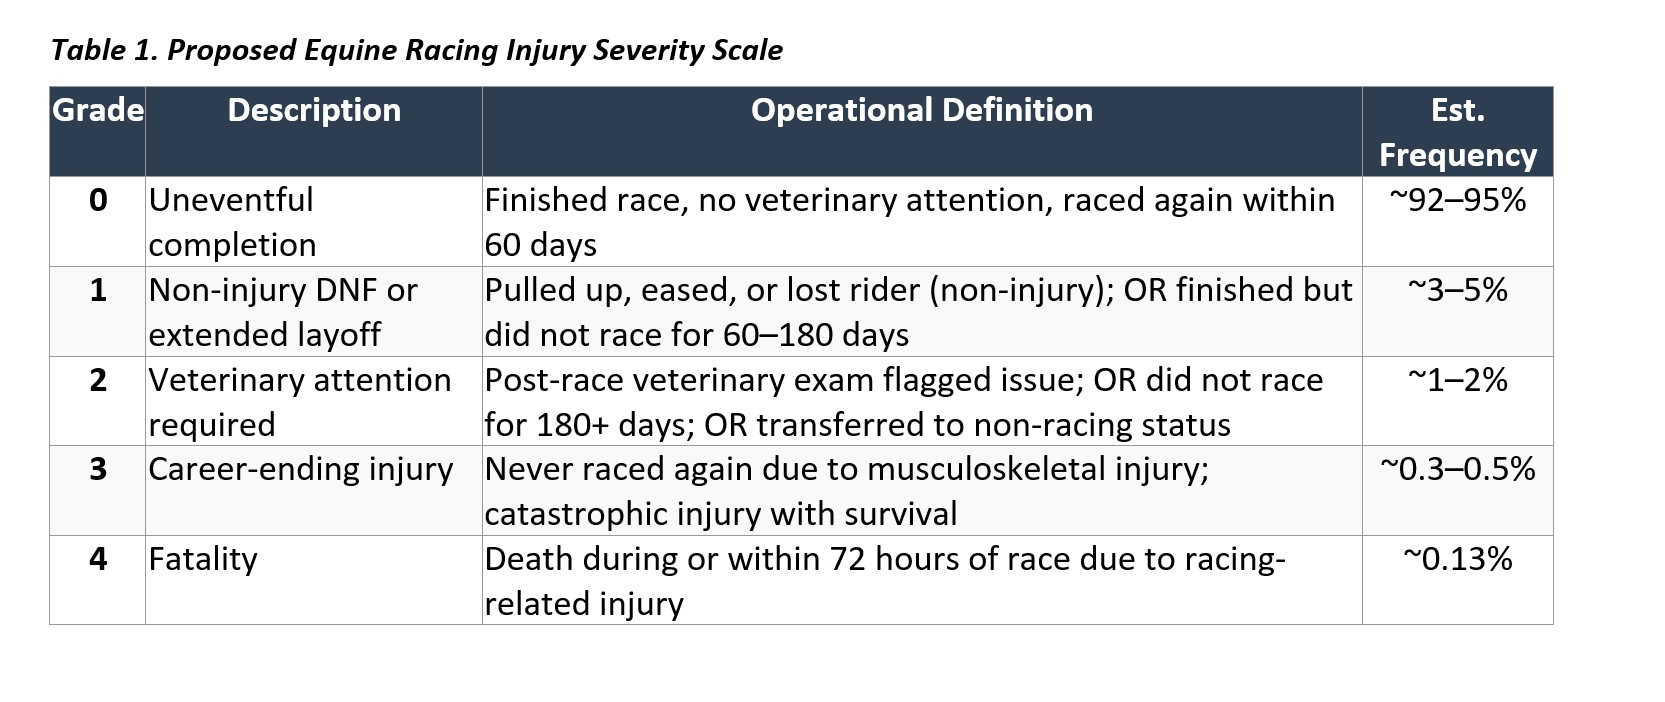
Yes a method such as cubic splines or smoothing will allow for interpolation to reduce mean squared errors of estimates. But there is limited information in rare events that are coded as binary. More information and precision can be extracted if there is a graded outcome scale, especially one that includes near-injuries.
2 Likes
Very much so, and can be handled elegantly with an ordinal regression model.
1 Like
It seems to me that mere technique (here, ORMs) can’t recover what’s lost in a fundamentally incurious, phenomenalistic and therefore unscientific approach to this problem. I see the same mistake here as in so much discussion of human maternal mortality: the data at hand (death counts) are treated as the thing-in-itself when they are merely phenomenal manifestations of the detailed workings of nature that we should be aiming to understand.
Just as I never see maternal mortality disaggregated according to its several distinct causes, I’m not getting any sense for what these fatal MSI’s are or how they occur. Football coaches ‘run the tape’ because they care about winning next time, which requires addressing causal questions.
What’s actually occurring in the real world here, as opposed to the data tables? How many of the MSI’s are due to identifiable moments in the race where a ‘mechanical’ factor can be seen on the tape? (I’m adapting the lingo ‘mechanical fall’ used in medicine to distinguish tripping on an obstacle from an organic cause like syncope.) How many of the cases lack any such identifiable ‘mechanism of injury’? What are these injuries, anatomically? Etc.
1 Like
David those are excellent points. My interest was how you would demonstrate that policy changes are impacting an outcome over time, particularly when the outcome can be noisy. Policy makers like to tout the year to year even month to month changes without accounting for uncertainty and regression to the mean.
1 Like
The policy people ruin everything.
The first thing we do, let’s kill all the lawyers
— “Dick the Butcher” in Shakespeare’s Henry VI, Part 2, act 4, scene 2
2 Likes
If the policy change was implemented uniformly at a known date, you can look at allowing for a trend break/slope change there and assessing the statistical evidence for its magnitude (see example here 2 General Aspects of Fitting Regression Models – Regression Modeling Strategies ).
1 Like
That example also indirectly points out that sometimes it’s better to fit a flexible model that does not put special emphasis on the change point, then see if there is impressive evidence that what happens happens at the prespecified change point.
2 Likes
What are your thoughts on the difference in differences methodology comparing locations pre and post policy implementation… based on whether the policy was implemented at that locations (track) or not?
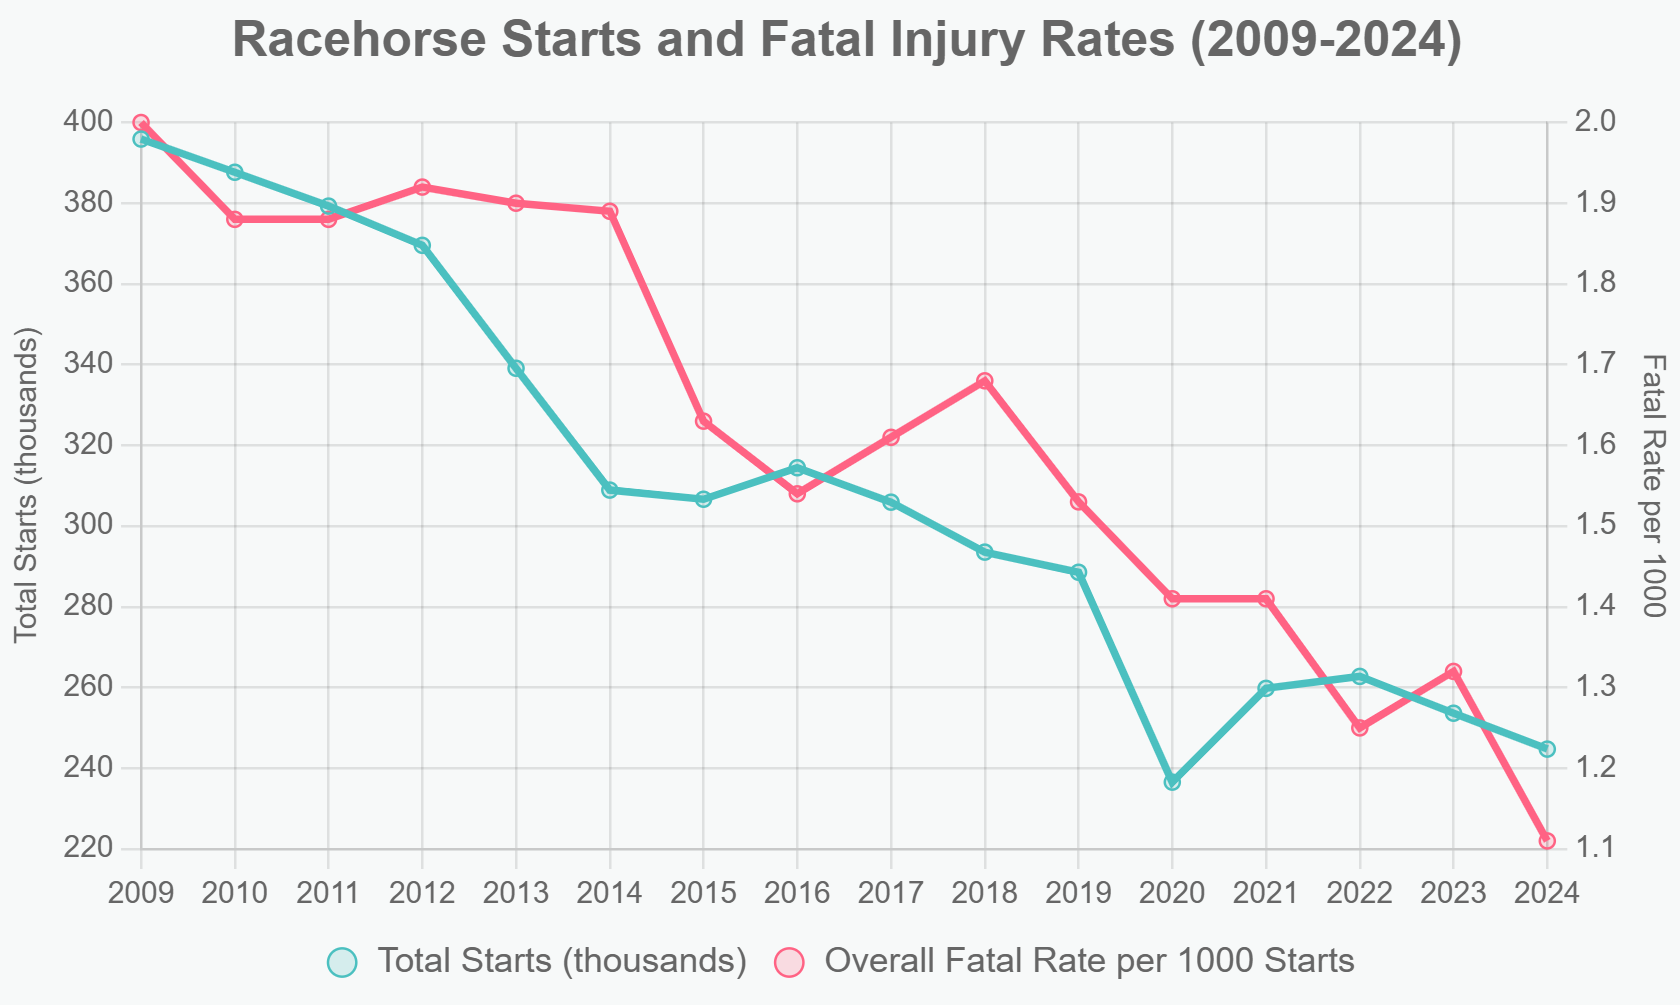
From a mathematical standpoint… if the denominator of your outcome measure is decreasing (starts) could that falsely impact your outcome fatalities/1000 starts. Primarily because it may change the makeup of your sample. Perhaps selecting for more robust participants?
Read right-to-left, this looks like the classic increasing marginal cost of increased production.
1 Like