I have a bit of a statistical conundrum that I can’t quite wrap my head around. It appears very simple, but the results are very counterintuitive, and I just can’t find an intuitive explanation. This all originated with a much more complex model, but I’ve created a very simple example to explain the confusion that I’m having. Any help would be hugely appreciated! I feel like I must be missing something really simple…
Thank you so much in advance for any help!
TL;DR: When testing for group differences in some trait, it seems that using multiple noisy measurements of the underlying trait have better power than using the values handed to us by an oracle.
Scenario
Let’s say we’re examining some property of a bunch of individuals - we can call it IQ for the example. We have two groups: group A and group B, and we wish to examine whether there are differences between these groups. We have 5 different IQ tests which all measure the same underlying trait, but they are all a bit noisy. An oracle then approaches us, and hands us a magical test which tells us exactly what each individual’s true IQ is, with no measurement error at all.
Question
In order to maximise our ability to detect differences between groups, do we A) administer all 5 noisy tests to each individual, or B) administer the single magical oracle test to each individual?
Simulation
I simulated individual true values with a mean and sd. I then simulated 5 measured values per individual with a given measurement error SD around each. I’ve included the code in a gist here: Power Question: multiple noisy measurements vs single noiseless outcome · GitHub
Analysis
I fit four different models to each dataset:
Using one value per individual
I) T-test of the true values
II) T-test of the mean of all 5 measurements
Using multiple values per individual
III) Fixed effects multiple regression: Y ~ 1 + Group + Subj
IV) Linear mixed effects model: Y ~ 1 + Group + (1 | Subj)
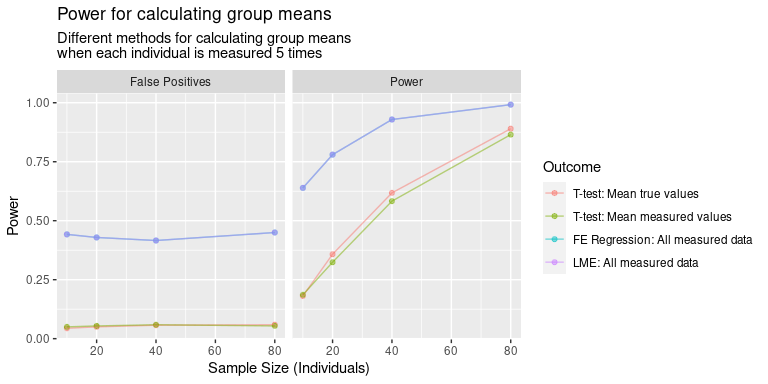
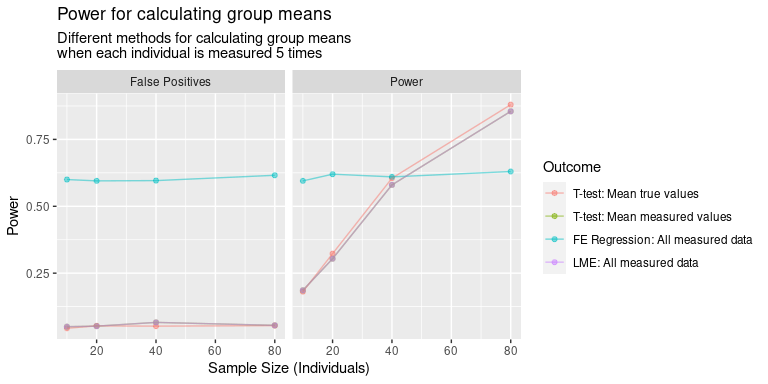
Results
In terms of power, the results are IV > III > I > II. That I is better than II is obvious, but I’m less satisfied with III and IV being better. In this case, we would reject the oracle’s test, and instead choose to measure each individual with our noisy measure? How can this be right?

I understand that we’ve got more samples, so our degrees of freedom are higher, so the SE will be smaller. But it feels extremely counter-intuitive that our model should have better power, without sacrificing type II error rate, for comparisons of multiple noisy measurements compared to the true values. The true population variability remains constant, so there’s always going to be sampling error. And the model examining the true values doesn’t have any measurement error, so the variance should be the correct variance for understanding the sampling variability.
Extension (the more complex model that spawned the question, for those interested)
This all originated in a hierarchical pharmacokinetic model that I’m fitting. We estimate underlying pharmacokinetic parameters (let’s say drug clearance) in two groups of individuals. We usually use models to estimate clearance in each individual from a time series of measurements in each individual, and then compare between groups. I’m now fitting everything simultaneously using a hierarchical model which also includes the group differences in clearance. In simulations, the model appears to exhibit even better power than having the true clearance values themselves. This seems incredibly counter-intuitive, more so than the above example, since we can only learn about the underlying drug clearance from the nonlinear function fit to the whole time-series of values. We expected to get closer to the true values, but we didn’t expect to outperform the true values…