We’re putting together a study of an intervention in the emergency department (ED). The outcome is length of stay, LOS (which we hope will be reduced). It is a step-wedge design with several clusters of two hospitals each. Each cluster will transition from control to intervention at 1-month intervals. There will be a two-month run-in phase.
The current version of the analysis model is a Generalised linear mixed model:
LOS ~ Study_arm + Study_site + Cluster + Time_of_presentation
Cluster is the month of crossover for a site.
Time of presentation is the month of presentation for an individual.
Cluster and Study site are random. Time of presentation and Study arm (Control or Intervention) are fixed.
I have three questions/uncertainties:
- LOS is also affected by business of EDs. In NZ this has been increasing over time (staffing and physical space not keeping up with demand). How best to account for this?
- Lockdowns and Covid rates affect LOS in ED. How best to account for these? [I may not have available Covid rates by site, but may have vaccination rates which could act as a surrogate].
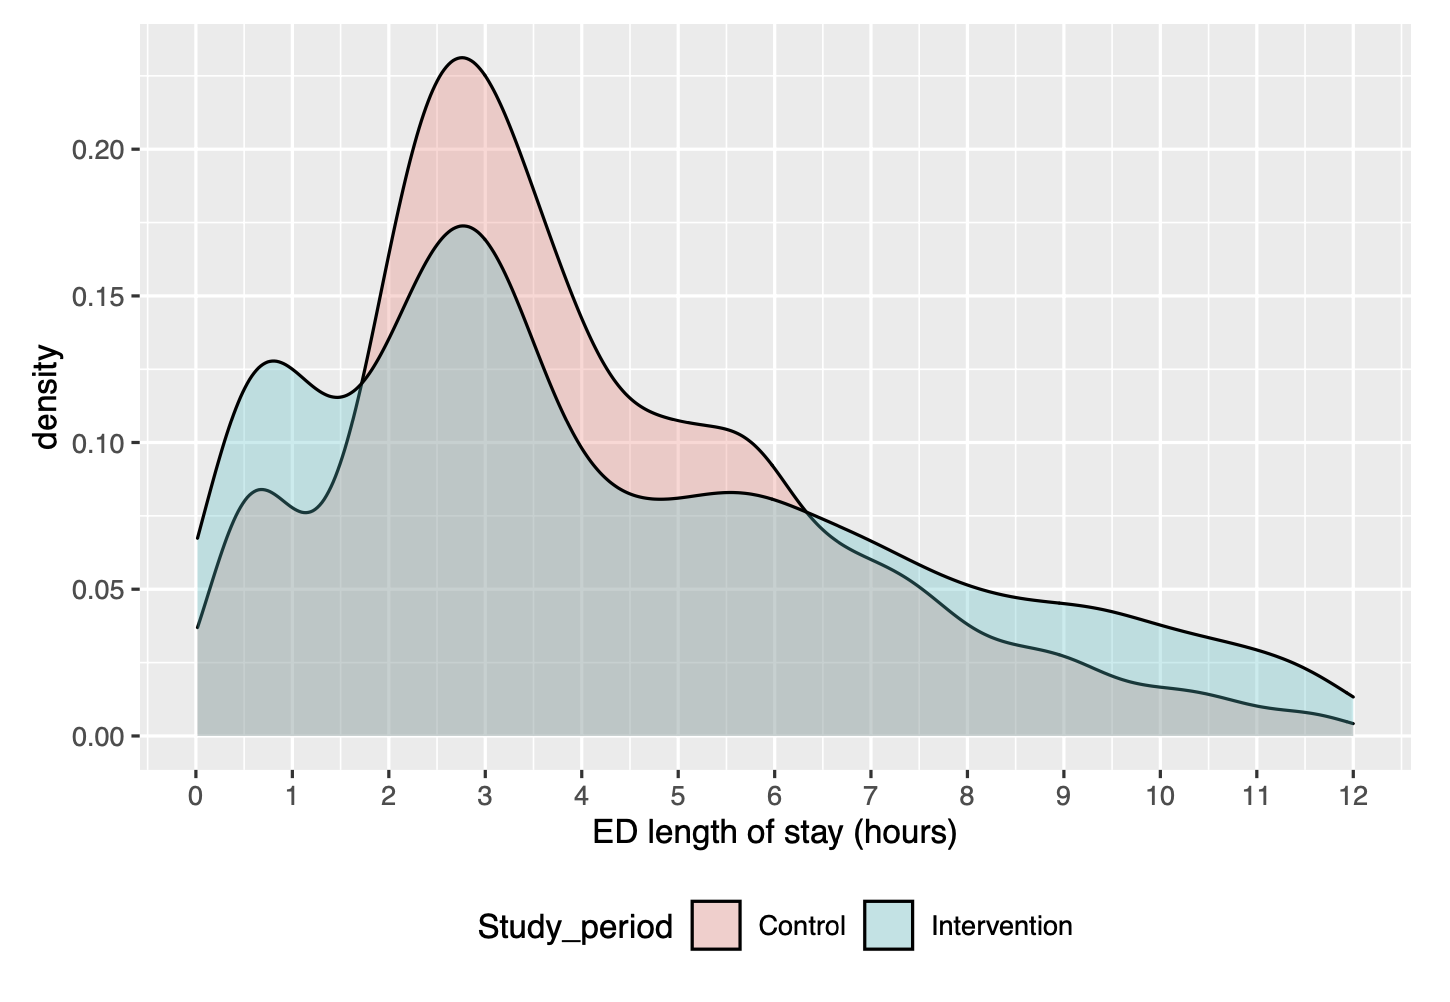
- The LOS is a funny distribution. The figure attached is from an earlier observation study in the same cohort following a different kind of intervention. The two or three peaks/humps are real given the clinical pathway. When I look at qqplots for linear models of LOS with this data they don’t look good. Should I transform LOS first (eg by a restricted cubic spline with at least 5 knots)?
Thanks
3 Likes
Is this a generic ‘process’-level intervention (such as a change to triage protocols) applicable to all patients of the ED, regardless of diagnosis? Or is it a new treatment protocol for a specific diagnosis?
Thanks David - it is a new process for a specific group of patients (consisting of ~5% of all presentations to ED). The LOS outcome is for that specific group only.
1 Like
Why is the intervention expected or hoped to shorten LOS? Will it lead to more rapid diagnosis, quicker application of some definitive therapy, or some other benefit? Are you prepared to detect that the special salience of a trial simply diverts ED resources toward the patients in this specific group?
Sorry for not responding… I’m not gettting notified for some reason. Must check that out. The expectation is shorter LOS in those deemed very low risk of a myocardial infarction.
1 Like
The patient population is then what would colloquially be termed “rule out MI”? Are the various tests and other assessments involved in this diagnosis timestamped automatically in your electronic health record? If so, then you could delve much deeper into the reasons why the process intervention is (or is not) working, and for whom. The mixture appearance of your distribution suggests there’s something worth understanding at a deeper level. I would take that hint and run with it.
Thanks David. We have a good idea of the reason for the bimodal appearance - some people can be ruled-out after only one blood draw, others require a second a couple of hours later. We are one of the groups that have developed these accelerated diagnostic pathways and so this is no surprise. I’ve had other advice that if I just use the LoS in a linear model “as is” then it will be OK [we will do secondary analyses using dichotomous LoS <2h, <4h etc]. Do you have an opinion on that?
I’m still trying to figure out the right variable to include to reflect the time variable business of the ED.
Why perform inference using anything other than a reasonable approximation to the DGP? Modern methods make this possible. The first moment here likely contains little of real interest to the doctors and nurses whose hard work will make this trial possible.