Authors try to assess the influence of cannabis on psychosis, and use a two arm design:
Arm A = patients in a clinic (+ self reported cannabis use)
Arm B = general population (+self reported cannabis use)
Participants in arm A turn out to use more cannabis (and more of everything else: more tobacco, more stimulants, more alcohol, etc.) and are more psychotic, hence, “assuming causality”, the cannabis caused he psychosis.
Problem is that the arms are defined based on the outcome. This strikes me as weird.
I have many more axes to grind with this study, but let’s go step by step!
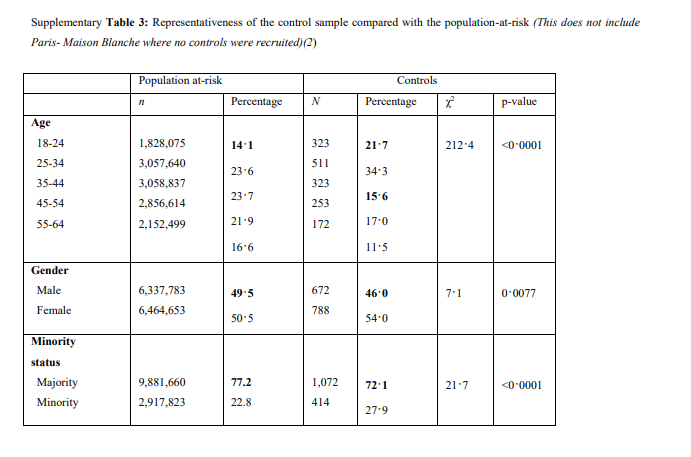
They did look at representativeness looking at age, gender, enthicity (sort of) and (not in this table) education, all fine, but that’s imho not the issue.Point is your comparing people with psychosis to the general population and attrribute the difference to 1 of the factors that you happen to measure. But probably the cases and the controls have a different genetic make up. Also I wouldn’t be surprised if the cases have lower incomes, more stress, etc etc.
Shouldn’t you compare like with like?
(For the record, I am an advocate of cannabis legalization because that is imho a better way to protect public health than prohibition, especially for vulnerable people. This may of couse mean I have a different confirmation bias, therefore I welcome critical voices )
Also, I asked for a link to a public data repository, turns out there isn’t and the authors “maybe plan to make the data available in 2020”.
How is it possible that a serious journal such as the Lancet allows publications based on invisible data? Isn’t it the essence of science that all steps should be transparent and up for scrutinity?
What good are precise references to literature, detailed tables & graphs, a detailed methods paragraph etc., if the main ingredient, the data, are not available?
If this doesn’t fit here,moderator please let me know or move or delete this post, no problem. Thanks!
Spot-on observation here. With 11 sites, the authors would have been working with a bare-minimum number of clusters. (On no less an authority than The Hitchhiker’s Guide to the Galaxy, Angrist & Pischke [1] advise using cluster-robust variance estimators on no fewer than 42 clusters.)
“On the basis of χ² and t-tests, data on the use of other recreational drugs were included as confounders in the main analysis, with low or no use scored as 0 and use scored as 1 in categorical variables: tobacco (never used or smoked <10 cigarettes per day vs smoked ≥ 10 cigarettes or more per day …and mean number of alcoholic drinks consumed daily on an average week.”
Data were included as confounders ??
Why should tobacco or alcohol use be a confounder for both cannabis use and psychosis? Since when are alcohol, tobacco, ketamine, novel psychoactive substances, stimulants etc. a gateway drug to cannabis? They mean covariate, perhaps?
Search for ‘significant’ variables to include those in the analysis? Really?
Random dichotomizations galore:
Why is “I never smoked” the same as “I smoke 9 cigarettes per day”? …
Why is ‘stimulants’ simply yes or no (“ever used cocaine?”) but is alcohol use measured in average glasses per day? Yes, I know the social acceptance is different, but a reseacher should look objectively, right? So when it is a very socially accepted drug (alcohol), they measure on a continous scale, cigarettes are measured 0…9 cigs per day versus 10 cigs or more; but socially less accepted drugs (stimulants, ketamine) are measured as “used this once or more” versus “never used”. Why???
“We applied adjusted logistic regression models to estimate the effects … bla bla… the data have a multilevel structure… bla bla”
SHOW ME HE DATA, SHOW THE MODEL, SHOW ME THE RESULTS!
Anyway, the authors calculate that if the cannabis market would only consist of ‘weak’ weed (with a THC-content of 10% or less, somehow in this case not 42 but 10% seems to be the magic number ), London would have -30% cases of psychosis, Amsterdam -50% but for instance Barcelona only -5%. Why? Don’t ask me and don’t try to find it in the paper!
Remarkable points (sorry, I’m just ranting for a minute, I’ll post some technical questions later):
all cannabis <10%THC has effect X; all cananbis >10% has effect Y, according to the authors. 10% is the magic number! But… why??
the differences between the cities are hard to explain. And the authors don’t even try…
the authors ignore findings such as that the UK, between 1970 and 2010, saw an increase in cannabis use by a factor 20 (!) but stable, even declining schizophrenia rates. Or the finding that schizophrenia rates (when comparing countries) seem totally independent from cannabis use. With high use countries (Canada, USA, Italy) having the same rate of schizophrenia as countries with a 15 times lower use (Sweden, Peru, Hungary).
I’ll stop now! So far “peer reviewed top journals”.
It’s pretty common that, when researchers can’t make their minds up as to whether a risk factor has confounding or mediating effects, they decide to “adjust for it” on the side of being conservative (or, at times I’ve heard, to be “thorough”). Of course, it doesn’t preclude the possibility of collider bias.
Also, one must wonder if all the education about Berkson’s bias has taught us nothing. Cases samples from clinic with psychosis diagnoses, controls from the general population. Yes, had the controls been sampled from the clinic, they may be more likely to have the exposure as a reason for their being a patient (I dunno, say glaucoma). What about the lead time of psychosis? Also, and I’ll wager, they used self report to exclude controls with prior psychosis diagnosis. But… can you trust self-report of psychosis diagnosis?
The only conclusion to this paper should be that patients who go to see doctors are sicker on average than patients in the general population.
On the positive, this makes a great example poor analysis and over-reaching conclusions. Perfect timing, since my next series of EBM lectures will be to the Psychiatry residents. So many great teaching points.
 )
)
 They mean covariate, perhaps?


