What is a fake measurement tool and how are they used in RCT

Thank you for the question. It seems likely that the reason that the studies are not reproducible is caused by changing mix of cases in each new RCT study group. The compromises made to gain larger cohort size produces a fragile state wherein the small baseline group of diseases for which the protocol is not the right treatment will not be stable. This baseline (and the associated protocol failure rate) can markedly increase if the disease population mix changes. Therefore one RCT will show benefit for the group and another will not because it’s a different mix.

No it is not reasonable. My point is that the hard work determining the signals which define the different diseases (and the mortalities of those disease), of which sepsis is comprised, has to be done but this is not possible if we a priori define “sepsis” for RCT by a set of unifying thresholds.

Very Very good question. We are designing one now and we don’t have a statistician in the mix yet. Given your question I will fix that next week.

No. I am simply saying that the math is a continuum from measurement to statistics to output.

If a statistician simply asked " What was the origin of this measurement (eg SOFA score) ? How reproducible is it? Where did these threshold cutoffs come from? Why are these signals chosen?

These are the questions required to make sure the statistician is not wasting her time embellishing a fake measurement. If nothing else these questions would result in an enhanced discussion of limitations of the trial which would help future researchers avoid repeating the design error. Without the questions we get what we have already seen in this forum, siloed discussions about the statistics used with the SOFA measurement, with no discussion of the math or limitations of SOFA. That fools the young researcher and statistician into thinking SIRS or SOFA are valid and reproducible measurement tools so they simply make the same mistake propagating the mistake for decades.
2 Likes

The fundamental point is that trialists do not understand this. To them SOFA is a tried and true measurement. It’s straightforward as sum of ascending thresholds of six signals of organ dysfunction so it must work. They can’t grasp that without weighting this cannot be valid and even with weighting it"s a fragile very limited set of static signals for a massive collection of diseases called a “syndrome” which is wider than any in medical science.

That’s why the statistician has to explain this stuff in ways they can understand because they are not going to change unless someone they respect shows them why, mathematically, they need to move on from this (respectfully) oversimplified thinking.

2 Likes

This is very interesting. Its beyond my pay grade but I will show it to the team.

We are applying ML in supervised learning mode using logistic regression to generate, for example AUC as a function of time. What are the limitations of the AUC/time? Are there better time measures we should be making other than AUC/time (and the derivatives of AUC/time).

Thanks for the thoughtful comments Paul. The one part I don’t understand is that if there is clinical expert consensus about the elements of the ordinal scale being in the right order, why would you need to look at treatment effects on individual scale components?

This is a key statement and reminds me of a component that should appear in a summary score methods paper that I hope someone writes: If you flexibly model the effects of all continuous variables (using e.g. regression splines), how many such variables do you need to provide the same predictive discrimination as contained in the entire summary score? If you can easily beat the score, you know the score’s thresholding was information-losing.

On a related issue, ages ago I did an analysis on the APACHE III database that showed if you splined all the physiologic variables the added information equaled the total information in all the diagnostic indicators used in the APACHE III. In other words, if you extracted maximum information out of continuous predictors, you could ignore the ICU admission diagnosis.

1 Like

it has become convention to analyse components separately, im pretty sure EMA guidelines demand it, but see eg chapter “Composite endpoints in clinical trials” in Methods and Applications of Statistics in Clinical Trials.

also, from experience id anticipate that the clinicians will became very interested in any “result” and it will incite secondary analyses in the hope of understanding it precisely, and when this fails it will invite discussion and promote sceptism

regarding why we would analyse components separately, you made a point in the quality-of-remdesivir-trials thread: “we know from the international survey of thousands of patients that they place great weight on shortness of breath”

i appreciate this point, however i think eg Sun et al. showed in their paper that dyspnea can dominate a composite: Evaluating Treatment Efficacy by Multiple End Points in Phase II Acute Heart Failure Clinical Trials

you can see in table 4 that VAS AUC is superior to the clinical composite on power. And that is fine, i would just want it made explicit what is driving the result, rather than being hidden in the mechanism of the calculation for the composite

I tried to show, by defining “Influence”, that patient reported outcomes can drive the difference observed on the composite measure, and how this Influence is sensitive to the arbitray cut-offs used: Examining the Influence of Component Outcomes on the Composite at the Design Stage

im not sure to what extent any of this is relevant for the covid ordinal outcome, but one common issue with these rankings is what to do at the lowest rank. Some have suggested using eg a biomarker to discriminate between these indiviuals rather than leave some large % of the sample with a tied rank (when clinical events are low). But then the biomarker overwhlems the composite (i tried to illustrate that here: cjc, see global rank in fig2)

i just dont think many will be satsified with a conclusion of the kind: the intervention is superior on some conglomerate of outcomes, it’s inviting scepticism and people like to practice scepticism

Paul as with your “biomarker overwhelms the composite” statement I’m having trouble with the logic. If clinical censensus pre-specifies the severity ordering, why second-guess it after the data are in? If patients give a lot of weight to dyspnea, why not count it that way?

Some background needs to be added to my question: What we really need is careful patient utility elicitation (using time tradeoffs, willingness to pay to avoid complication x, etc.) and then to make inference on the utility scale. Since we are unable or unwilling to go to the extra trouble of running a utility study before the clinical trial is completed, we can use ordinal outcomes to approximate the utility analysis. And if someone later specified utilities, the same ordinal model can be used to estimate expected utilities by treatment.

1 Like

one reason is, i dont think we’re willing to forgo a precise definition of “better”. In the remdesivir thread you give the interpretation for PI: “The estimated probability that a randomly chosen patient given treatment B has a better clinical outcome than a randomly chosen patient on treatment A is 0.7”

i can’t imagine many researchers will be satisfied with this as the conclusion of a pivotal RCT. I worry, also, that it’s a sleight of hand; much scepticism has been sold to us re surrogate endpoints (piantadosi’s book comes to mind). Smuggling in surrogate endpoints seems to me quite cheeky

with undue cynicism i always ask myself: could i rig a clinical trial with this method (in the spirit of marcia angell). We are seeing composites now appearing in diabetes, composites of a1c, hypos and weight gain maybe. Okay: if I know the competitor’s drug is not as good on weight gain (consider novo nordisk v anyone), they treat to target so they’ll may match on a1c, and I would define the weight gain as miniscule, and then I’m going to win

there’s a lot I can do when no one can see the inner workings of the composite which is quietly trading off events, it’s too murky

edit: i should have also said that agreement on ordering/ranking is not easily achieved and likely researchers not involved will contest it. there are classic example where patients and clinicians order differently eg patients give stroke higher rank, and the paramount thing is to produce a result that will persuade

2 Likes

Why couldn’t a procedure like Saaty’s Analytic Hierarchy Process (and the extension Analytic Network Process) be used to determine the rankings? That way, the outcome system can formally balance the needs/preferences of patients with the scientific needs of the investigators.


1 Like

i do prefer pre specified weights to the ordinal/ranked outcome. but id just make one point: it’s been around for a while and no one is using it. you have the biggest names in cardiology pushing them and still no one is using them. When weights are made explicit they look flimsy and untenable, that is the advantage of the ordinal outcome, you obviate that problem. With all the benefits of bayes it remains on our bookshelf, why? I think, likewise, when trying to infuse weights into an analysis, people will have a visceral reaction to that, possibly, and with all this talk of reproducibility we really want to start prespecifying weights and using bespoke endpoints?

edit: i should say i was reacting to this comment on the wiki page: “It represents an accurate approach for quantifying the weights of decision criteria.”

To keep a good discussion going: Why do you refer to the less parts of an ordinal outcome scale, e.g., dyspnea, as surrogate outcomes? From a patient-oriented perspective aren’t they full outcomes?

2 Likes

Maybe I’m interpreting this wrong, I understood the quote above to mean that others think that these ordinal scales are examined sequentially in descending priority for the “significance” of benefit.

If I understand you correctly, you just want to estimate the OR at all points of the scale simultaneously, and leave the decision to the audience.

I think your method leaves open the possibility of predicting benefit from covariates.

I’m looking forward to clarification.

1 Like

yes, that’s what im suggesting. I tried to promote this by recommedning the prob index for all components and then overall composite and then displaying this a forest plot in the way of a meta-analysis, see the figure in this paper: effect size it’s also then possible to visually assess heterogeneity. but i worry such a summary would generate a lot of discussion rather than appease. I dont think it encourages predicting benefit from covariates, it’s likely to generate ambivalence. im secretly trying to undermine composites by recommending displays that betray their inherent problems

i received a phone call saying i was in contact with someone who had corona and i must self isolate. i had all the symptoms, headache, sore throat, shortness of breath etc. i went for the test and it was negative. nocebo effect i guess. that is a partial reason. the bigger reason is that it’s not explicit, that’s all i really have a problem with. I worry all people hear is: “we used a composite of hospitalisation and some other things” and there was an effect, but maybe 10% of the admissions data have contributed to that result, but people read the abstract only, and it moves as away from estimation putting more emphasis on significance testing. we were told as undergrads that estimation is key
enjoying the discussion, cheers

1 Like

Combining the measured features with subjective features converted into numbers to generate a function may or may not be reproducible.

Referring to critical care data, we are replete with objective numbers but there is also the conversion of subjective data (e.g. pain, sedation, coma scale) into ordinal scales. Dyspnea is like pain, very subjective.

Some subjective scales are considered fairly strong for example, the glasgow coma scale (GCS). Others are are considered weak (dyspnea and pain). Reproducibility is the key. I loved the characterization made by Robert Ryley, asking the question…does the feature (as rendered) rise to the statistical level? If it does not it cannot be used.

Consensus itself is a subjective term which does not necessarily convert a feature into something that rises to the statistical level. Consensus may be driven by the alpha male or, now that they are allowed (at long last), the alpha female in the group or affected by the general bias of the group. The use of tools like the Delphi method to deal with the alpha problem does not solve many of the other problems.

The SOFA score is a classic case. It is a perceived “function” which is comprised of the sum of 6 ordinal threshold based values derived from one man or from consensus (who knows) and essentially unchanged for 24 years. The question here is not whether the tool is useful clinically but rather does it rise to the statistical level to be used as a independent variable or a primary or secondary endpoint in RCT.

Here the issue of weights is pivotal. Presently there are no weights responsive to the physiologic systems. The 6 values are from 6 physiologic systems and unlike all people, physiologic systems are not created equal when it comes to mortality risk. Now I pointed out that problem before in this forum. This means the the same score can result in markedly different mortality depending on the perturbed system mix. This means that if the SOFA score is applied as an endpoint in an RCT for a multisystem condition with a typically protean progressive propensity, SOFA will not rise to the statistical level, because it will not render reproducible results as its output is dependent on which physiologic system distortion dominates in each cohort.

Could that be improved with weights determined using a massive dataset optimizing for mortality. Of course, but the weights might still be dependent on the disease mix. The data set (6 static values) is likely a fragment too small.

Here we might ask what rises to the statistical level for “sepsis”. How about a value of the WBC (by itself)? No, that is too small to rise to the statistical level by itself. The WBC is never the only value available so it would always be wrong to interpret its meaning by itself.

I think that is the question to ask. “Does this measure rise to the statistical level?” If there is no evidence that it does then the team may be engaged but can be simply performing another study which renders clicks, and perhaps tenure, but can be thrown on the heap of past studies which do not contribute to the advancement of knowledge in the field, and worse, distracts the young.

4 Likes

Apologies if what I’m about to say doesn’t make sense-I don’t know anything about “machine learning.” I get the impression that your research uses sophisticated computerized methods to examine how constellations of various physiologic markers change in sepsis patients over time (including which constellations tend to predict death)? Presumably, the reason why this is important is that it’s plausible (and even likely?) that certain therapies will only work if administered at a certain point in a septic patient’s clinical trajectory (?) And if the patients enrolled in a given sepsis trial are all at very different points in their clinical trajectory when they receive the treatment being tested, then only a small subset might stand any chance of responding to the therapy (?) In turn, the trial will stand no chance of identifying the therapy’s intrinsic efficacy(?)

So to summarize, what you’d really like to see is statisticians challenge the prevailing view among clinician researchers that SOFA scores are a sufficiently granular tool for identifying patients who are at similar points in their clinical trajectory (?)

Partially. You are correct. Unlike acute coronary syndrome or stroke, patients with “sepsis” arrive at different points along the continuum and there is no way to determine when the condition started. Furthermore the source of the infection, the organism and other factors affect the trajectory. Necrotising fasciitis due to group A streptococcus (GAS) can kill very rapidly as GAS is a human predator which does not often infect animals in nature. We are its protein source and it converts our proteins into weapons. Candida on the other hand lives with us but upon entering the blood can lead to death. The trajectories of these are different. The perturbations may be different.

For example we were reviewing GAS necrotising fasciitis cases today. Most did not have a platelet fall. We need to determine if that is true for a large cohort. If it is SOFA, which uses platelet thresholds as part of its sum will likely be lower in GAS necrotising fasciitis even though the patient is rapidly dying. Failure to include sufficient alternative markers of mortality means that the mortality is not reproducible. It’s like assessing the lethal power of an army by quantifying tanks, troops, and missiles and missing helicopters. With some armies it would work but its not a suitable metric for all armies because it is incomplete.

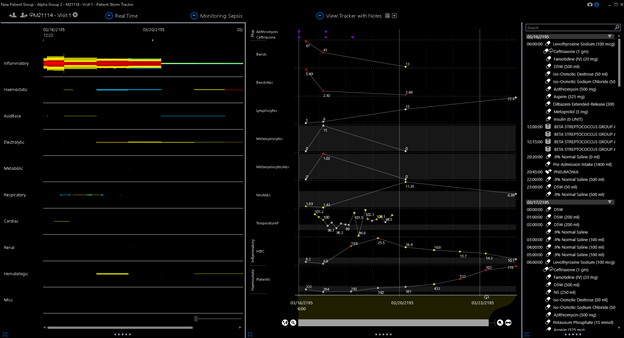
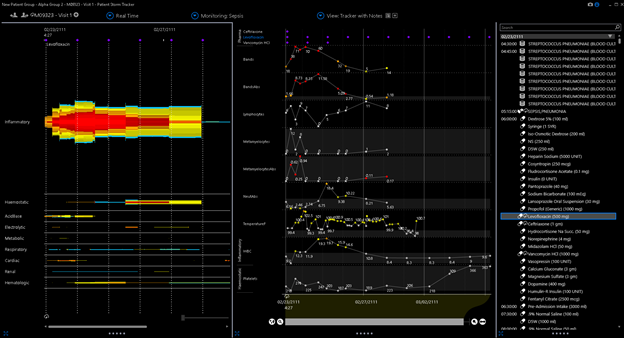
For example This is a case of profound pneumococcal sepsis yet the platelet count does not fall. (these data are open access from Mimic database)

image

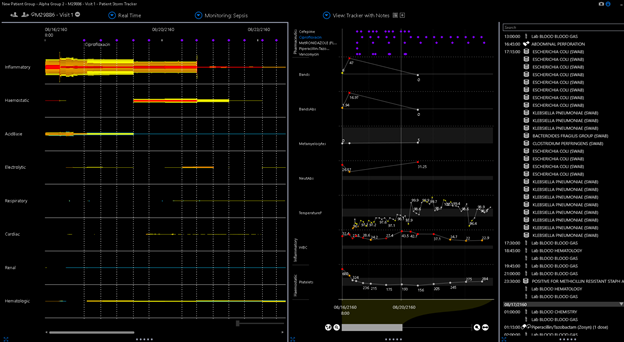
The other problem is the thresholds used to derive the ordinal scale is static. The first point of 1 is obtained at a threshold of 150. Here is an image of profound sepsis due to bowel perforation. Note the platelet fall never reaches the SOFA threshold of 150.

image

Here is GAS bacteremia.

image

Now in the these cases there were other extant markers for mortality which were not captured by SOFA and in the second case the platelet fall was significant (but not captured by the 150 cutoff of SOFA). Now the platelet count commonly does fall in a large percentage of cases so that’s probably why they chose it but its the mix which will then trip the reproducibility up.

So an ordinal measure is incomplete if there is a lack of validated weights, capricious cutoffs, too few signals, and SOFA meets all those limitations. Such a measure does not rise to the statistical level for broad application in sepsis RCT no matter how many people advocate its use.

I would welcome those in this forum who discussed at length the statistical outputs Citrus-ALI post which used SOFA and an endpoint. A deep debate would be very helpful to advance sepsis science which has been so plagued by non reproducibility that the NIH representative at the recent SCCM questioned whether further funding was warranted until we better understand the condition. Do you support or use the SOFA score in RCT? Will you use it if the PI says she wants to use it? If so, please bring debate. It’s the best way for all of us to learn.

4 Likes

Great discussion. One angle that is missing is quantification of the extent to which scores such as SOFA approximate the “right” score, and the fact that often what happens in clinical trials is that trial leadership replaces a flawed outcome measure with an even more flawed one such as a binary event of the union of a series of binary events, failing to distinguish differing severities of the component events.

1 Like

Displays that exhibit inherent problems with composite endpoints have more do to with exposing the inadequacy of the study’s sample size than anything else. If you want to be able to provide efficacy evidence about components of a composite outcome you need much bigger sample sizes than we are willing to entertain. Short of that, IMHO we should put our energy in to deriving and checking the outcome measure, then stick with it, and definitely not by concentrating on simple statistics for low-power component omparisons.

Just as with meta-analysis we must use Bayesian borrowing across endpoints to make sense of the collection of component outcomes. For example you can put priors on partial proportional odds model components to control the heterogeneity of treatment effect across components, as described in the first link under https://hbiostat.org/proj/covid19.

[quote=“f2harrell, post:27, topic:3955, full:true”]
Short of that, IMHO we should put our energy in to deriving and checking the outcome measure, then stick with it, and definitely not by concentrating on simple statistics for low-power component comparisons.

Agree, In my view the key words of the quote being “deriving and checking” not “guessing and promulgating” that is all I am asking for. No guessed measurements from the 1990s for 2020 RCT.

1 Like