Why the Non-Reproducibility of Acute Care RCT? The CAP studies

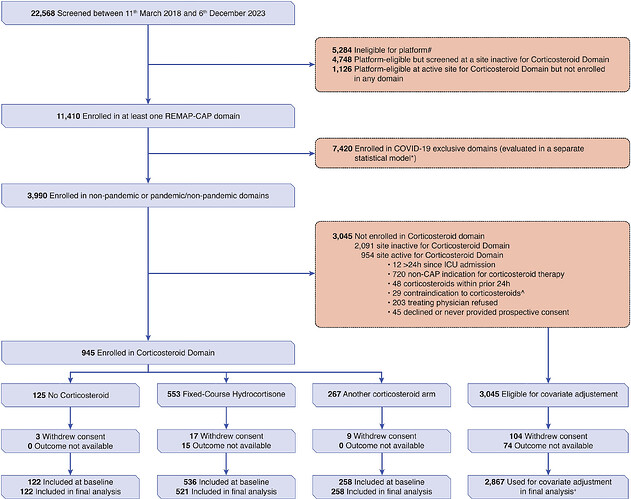
This is a discussion of the RCT of hydrocortisone treatment of severe community acquired pneumonia (CAP). As with many RCT in critical care medicine the results are conflicting in various RCT. The most recent RCT is from the highly touted REMAP CAP led by the editor in chief of JAMA suggested harm but this treatment is presently part of the treatment guidelines for CAP so this is a pressing issue.

Guidelines based on RCT that are subsequently reversed due to subsequent RCT showing harm are relatively common in critical care.

This thread seeks participation for the discovery of the cause of this the lack of reproducibility of perceived high quality RCT in critical care.

Here is the URL to the REMAP CAP

SpringerLink

Effect of hydrocortisone on mortality in patients with severe…

Purpose To determine whether hydrocortisone improves mortality in severe community-acquired pneumonia (CAP). Methods In an international adaptive randomized controlled platform trial testing multiple interventions, adults admitted to the intensive…

and link to PDF

link.springer.com

s00134-025-07861-w.pdf

Here is the link to CAPE COD

PubMed

Hydrocortisone in Severe Community-Acquired Pneumonia - PubMed

Among patients with severe community-acquired pneumonia being treated in the ICU, those who received hydrocortisone had a lower risk of death by day 28 than those who received placebo. (Funded by the French Ministry of Health; CAPE COD…

And to the Cochrane meta analysis

This is a very important question in acute care as these severe pneumonia patients are often otherwise quite healthy.

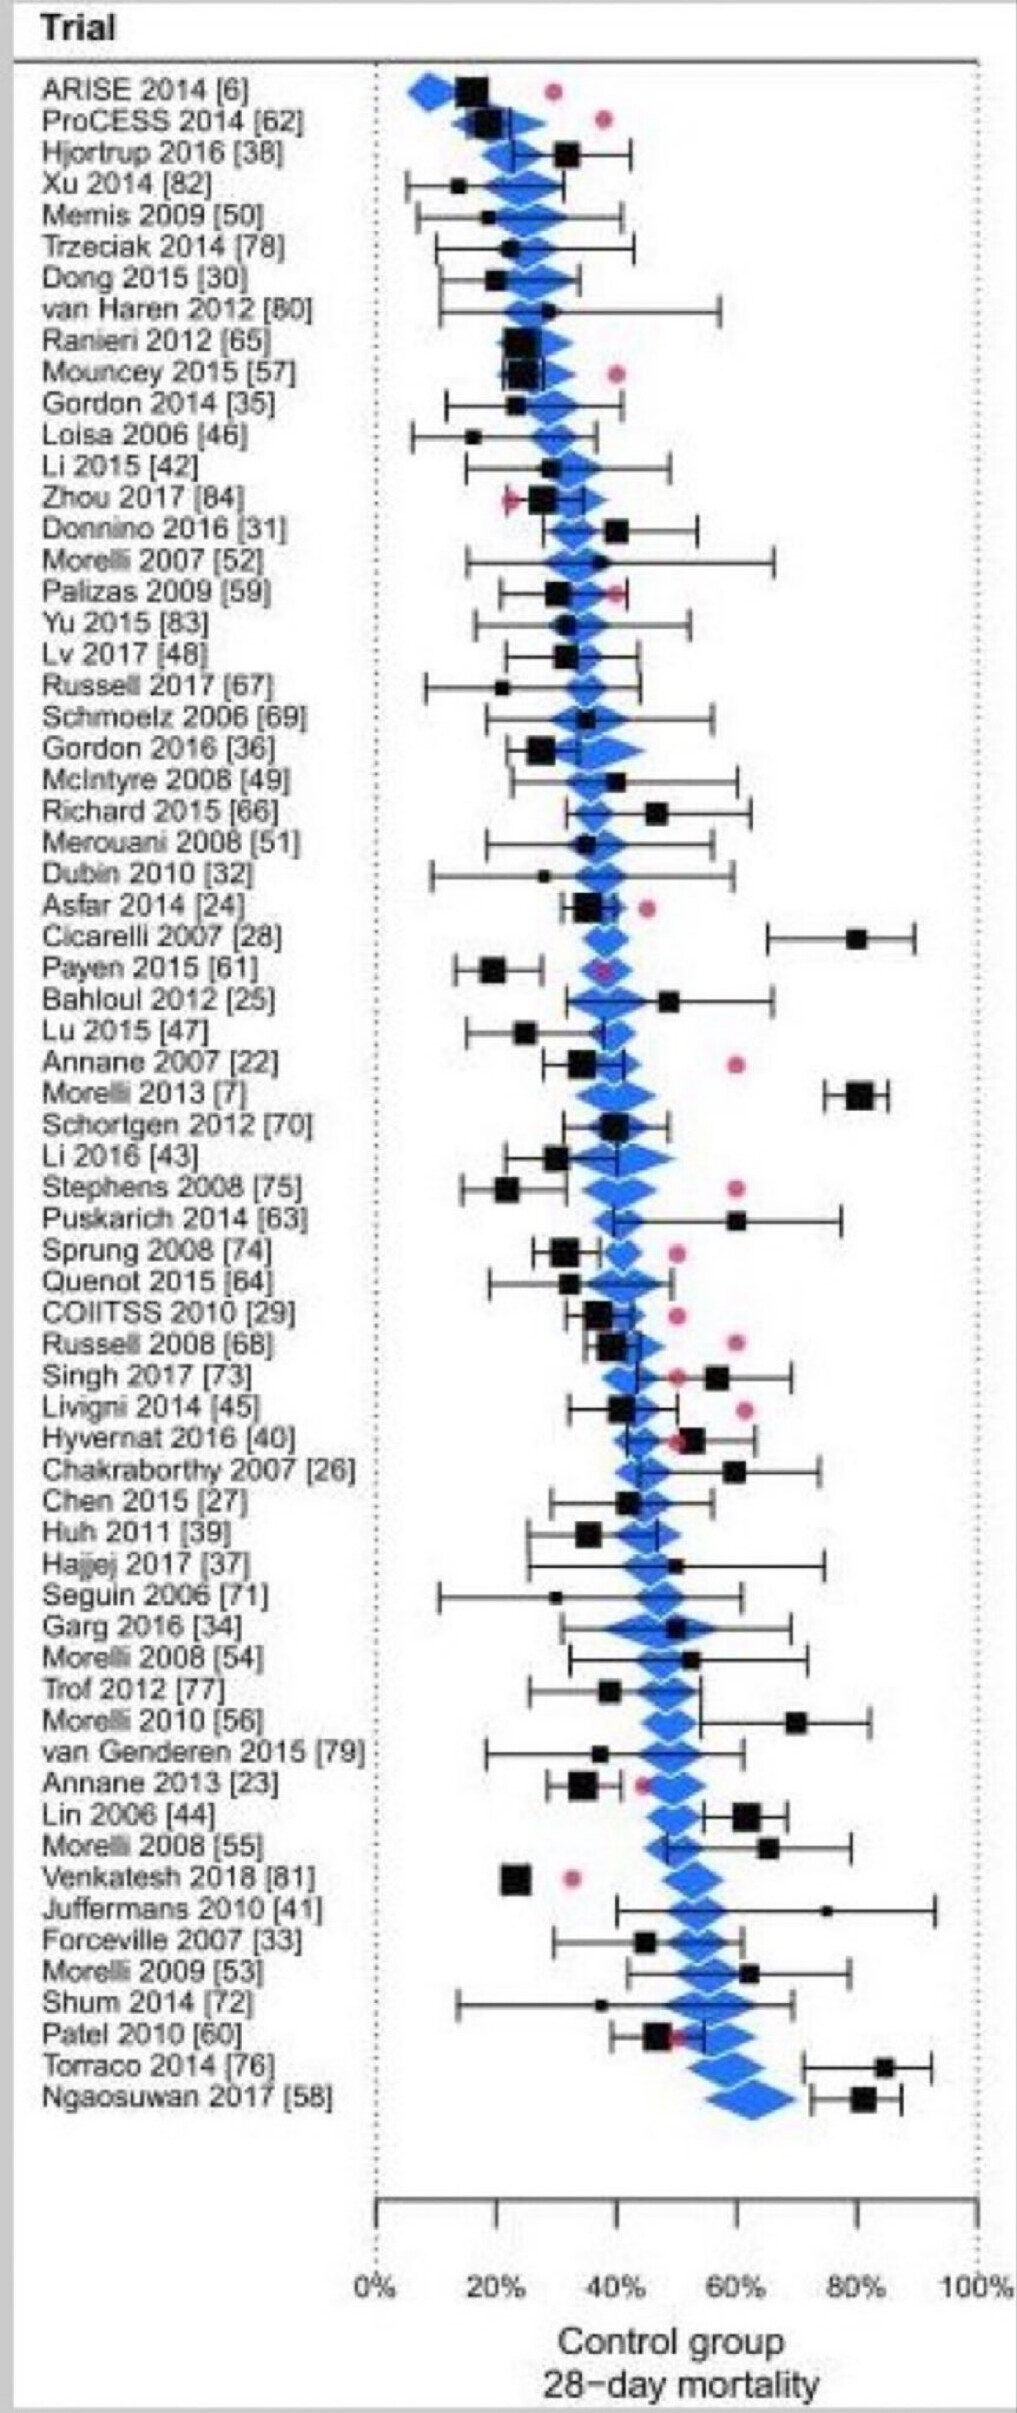
RCT Reproducibly has been very low in the conditions of sepsis and ARDS. We thought that in Community acquired pneumonia (CAP) the signal was fairly strong. Yet CAP is a mixture of many very different diseases. For instance methicillin resistant staph aureus pneumonia is markedly different clinically from Pneumococcal pneumonia and even more pathophysiologically removed from influenza A pneumonia. These are all mixed under CAP.

I look forward to your thoughts. Right now I’m not sure whether to prescribe hydrocortisone or not in this setting.

1 Like

Here is an article which presents the mortality of the control groups captured by the non disease specific triage set of thresholds used to select participants of 60plus sepsis PettyBone RCT.

This is relevant to the discussion because CAP like sepsis is a “synthetic syndrome” comprised of over 50 different diseases.

1 Like

Whenever someone constructs a graph like that it is useful to add a touchstone. The the overall risk of mortality from all studies combined and simulate draws from a binomial distribution with that probability but with actual study sample sizes. Plot alongside the graph. Often you’ll see the same amount of variability as in the original graph due only to chance.

I’m trying to follow your point . This graph was requested by a reader of this thread.

It was originally published to show the range of mortality of the controls in 65 PettyBone type RCT for sepsis. The authors argued that n was not high enough given the baseline mortality and the mortality endpoints. There has been talk of excluding mortality which was clearly not due to “sepsis” (a hard thing to do) or greatly increasing n.

Yet there is another point. It’s hard to imagine this range of variation in baseline risk across these studies with a single infection such as influenza A or pneumococcus. So the variation of mortality from less the 18.6% to more than 60% has been thought to be due to different mixes of the lumped infection types in each RCT, some being much more deadly than others. Since these trials are worldwide this cause as well as baseline treatment competence and resources also likely contributed.

The real cause is unknown but it may be relevant to the instant ReMAP CAP study which is also a PettyBone design and included a lumped set of different pulmonary infections.,

(For anyone who has not read the companion thread, a PettyBone design refers to novel research design originating in the late 20th century which uses a guessed non-disease specific set of thresholds as a triage for the participants rather than evidence based disease or condition specific diagnostic criteria. This design is used in both OS and RCT.)

That range is a bit large for a homogenous process. But you can’t judge on the basis of variation in raw mortality estimates. You’ll be surprised how much variation there is in the proportion of deaths when the true probability of death is actually constant. Here are some steps for further exploration:

  • Do the simple simulation I suggested. I can easily run this if you had time to write out the control group sample sizes, comma separated
  • In meta-analyses where individual patient-level data are available, randomly permute the vector of 0s and 1s indicating alive/dead and recreate the chart. From the random permutations you know that the variation in mortality is just sampling error as all studies would have the same expected fraction of 1s.
  • Fit a random effects model to shrink the mortality estimates towards the grand mean so as to negate apparent differences that are just due to sampling variability (i.e., having non-zero widths of confidence intervals for mortality for individual studies).

The latter approach is used when comparing hospitals for adjusted mortality differences in quality improvement studies. It should be standard practice when lots of subgroups are involved, e.g., lots of studies.

2 Likes

Thanks for posting that graph of the control group confidence intervals from sepsis RCTs.

The suggestion by @f2harrell to perform a bootstrap analysis of the variance around the common mean of the reported studies sounds like a good idea to me. His point: a binary variable like mortality is very noisy, and considering that none of the studies appeared to have a sample size above 100 (I’m interpreting those numbers in square brackets as reported sample sizes), much of this heterogenity could be due simply to small samples. These were things I didn’t notice about this graphic the first time I saw it.

How much is due to sample size considerations, and how much to the patient mix can only be decided once we have a good idea of how much we should expect this binary outcome to vary if the common parameter assumption is true.

If we were going to look at this via meta-regression, sample size is one factor to consider. Perhaps we should list a number of others, in addition to the component diseases to explain these observations.

3 Likes

Thanks for the comment. It will take some time to generate a comma delimited table of the n for each of these.

The number in the brackets is the reference number. Many of these are massive RCT. For example the ARISE study with a bracket number of [6] actually had 1600 enrolled patients from 51 centers. See quote from the study.

Methods: In this trial conducted at 51 centers (mostly in Australia or New Zealand), we randomly assigned patients presenting to the emergency department with early septic shock to receive either EGDT or usual care. The primary outcome was all-cause mortality within 90 days after randomization.

Results: Of the 1600 enrolled patients, 796 were assigned to the EGDT group and 804 to the usual-care group.

So many of these are massive Petty Bone RCT which is the standard in critical care. This massive number of patients were easy to identify as they triaged with a disease agnostic set of thresholds which was guessed in 1989 by Roger Bone called SIRS and some additional thresholds. These thresholds were standardized by the sepsis definition task force.

ARISE was criticized at the time for having a profoundly low mortality in the control group although my personal experience managing cases in the ICU with infection induced shock mortality was that low so I don’t follow the argument as definitive.

The problem I see is these profound mortality rates. They either had a mix of very severe and resistant infections, very late detection, a moribund baseline risk patient population or undertrained or under resourced physicians and staff.

The mix with very severe infection types dominating in the participants seems the most likely which is consistent with the point that disease agnostic participant selection by a guessed triage threshold set (PettyBone RCT) renders a different mix of different diseases for the treatment under test with each new RCT.

I warned the Australians at the time not to be intellectually colonized by a guessed set of threshold for triage made and standardized in USA. They did not listen. All three of the massive harmonized PettyBone EGDT trials were negative.

Not surprisingly that guessed threshold set for triage (SiRS) was finally abandoned only 2 years after ARISE so the Australians should have heeded my warnings. This abandonment occurred 23 years after its standardization for research and it was abandoned due to massive recurrent PettyBone RCT reversal of PettyBone RCT guided EMB based protocols.

In 2016 the task force, rather than questioning the PettyBone methodology. decided to use another guessed set of thresholds for triage called SOFA. SOFA was guessed in 1996. SOFA was used as triage in the Aspirin for sepsis PettyBone RCT from Brazil published last month and mentioned in the other thread.

RE MAP CAP (the instant PettyBone RCT at issue) lumps different types of community acquired by another triage set to identify PettyBone RCT participants so influenza pneumonia is disease agnostically mixed with pneumococcal pneumonia and many others in a disease agnostic mixture). If influenza A pneumonia is the only pneumonia responding with harm, the ATE of the PettyBone RCT will, in part, be a function of the %mix of influenza A pneumonia in the triaged set. This %mix of influenza A pneumonia will change (and potentially dramatically) with each new PettyBone RCT of a treatment of “CAP”

2 Likes