A colleague and I recently published a paper describing how a widely used model for predicting hypotension has been both developed and validated on data impacted by a major selection bias.
In essence, different selection criteria are used depending on the outcome, creating a biased dataset.
The model (Hypotension Prediction Index, HPI) is proprietary and build into a device used for monitoring patients during anesthesia.
I wrote a short summary of it on twitter, pasted below (https://twitter.com/JohsEnevoldsen/status/1561641153899929601)
HPI (a logistic regression) uses features derived from the arterial blood pressure waveform to assess the risk of hypotension in 5 min. It is displayed on the monitor as a number from 0-100. When the predicted risk is high (HPI>85), the device will alarm the clinician.
It was trained on features from 20-sec sections of arterial pressure waveform (predictors). Some labelled hypotension and some labelled non-hypotension (outcomes).
The methods section in the original paper presenting HPI describes the selection of outcomes and predictors (Machine-learning Algorithm to Predict Hypotension Based on High-fidelity Arterial Pressure Waveform Analysis | Anesthesiology | American Society of Anesthesiologists)
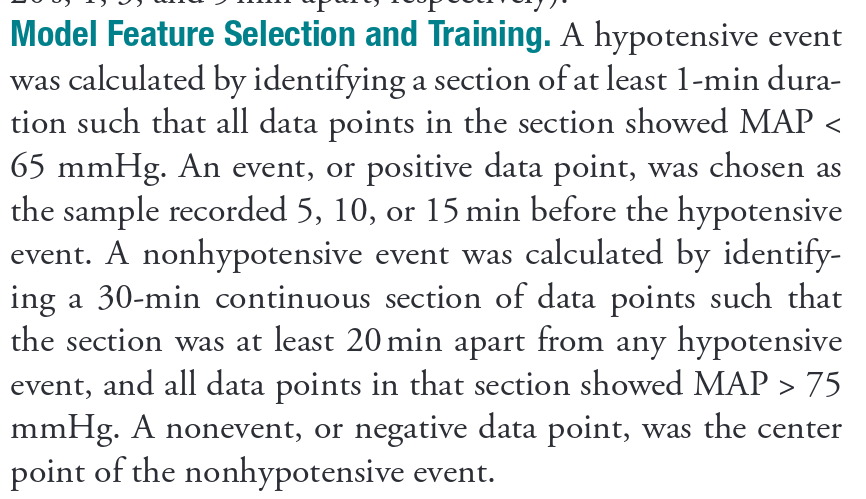
Features corresponding to hypotension were selected 5 (and 10 and 15) min before hypotensive events (mean arterial pressure (MAP) <65 mmHg for ≥1 min)
And here comes the problematic part:
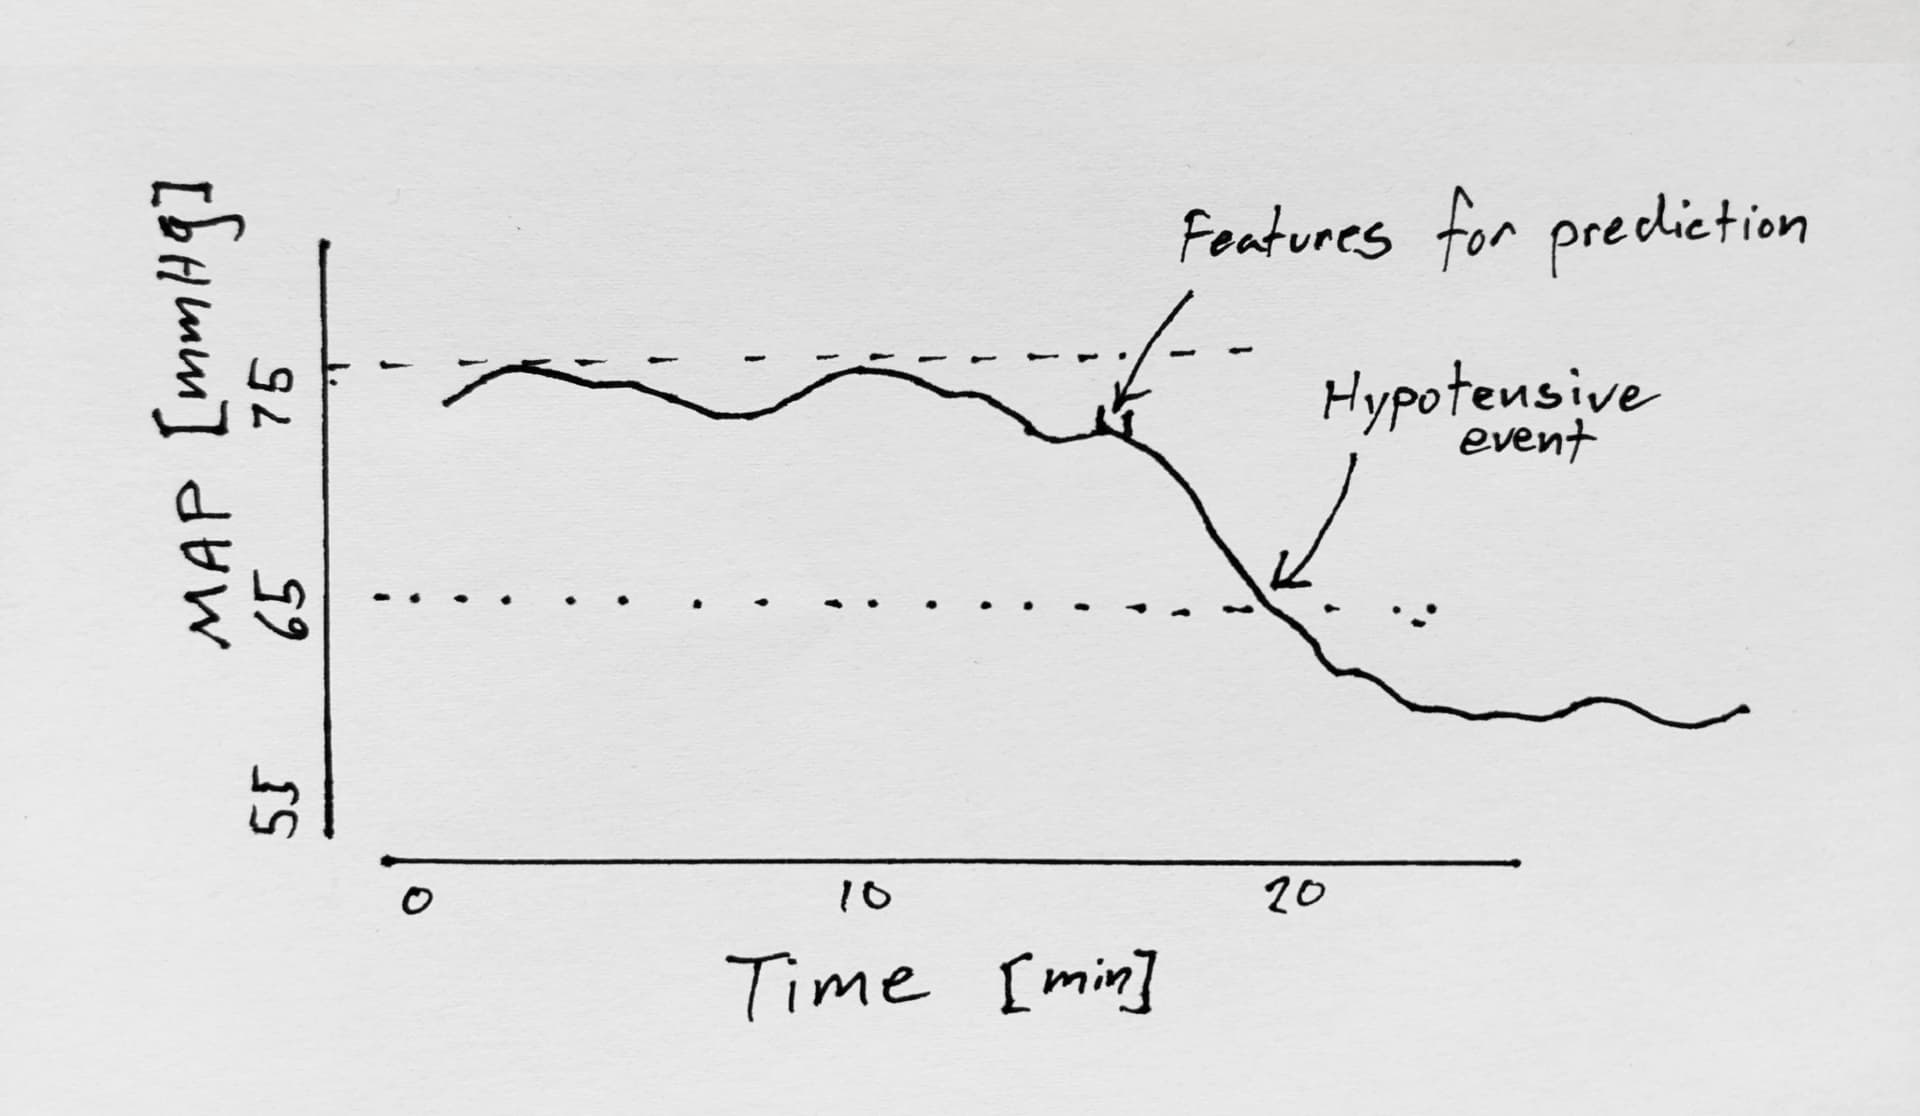
A non-hypotensive event was defined as a 30-minute period where MAP was continuously >75 mmHg. Features corresponding to a non-hypotensive event was the middle 20 sec of this 30 minute period.
Therefore, to predict hypotension with 100% specificity, you just had to guess “hypotension” every time MAP was < 75 mmHg. HPI (a logistic regression model) has probably learned this.
Importantly, this selection was used for both training and test data.
We made a simple visualization of what this selection does to a ROC analysis with MAP as a predictor of hypotension (simulated data).
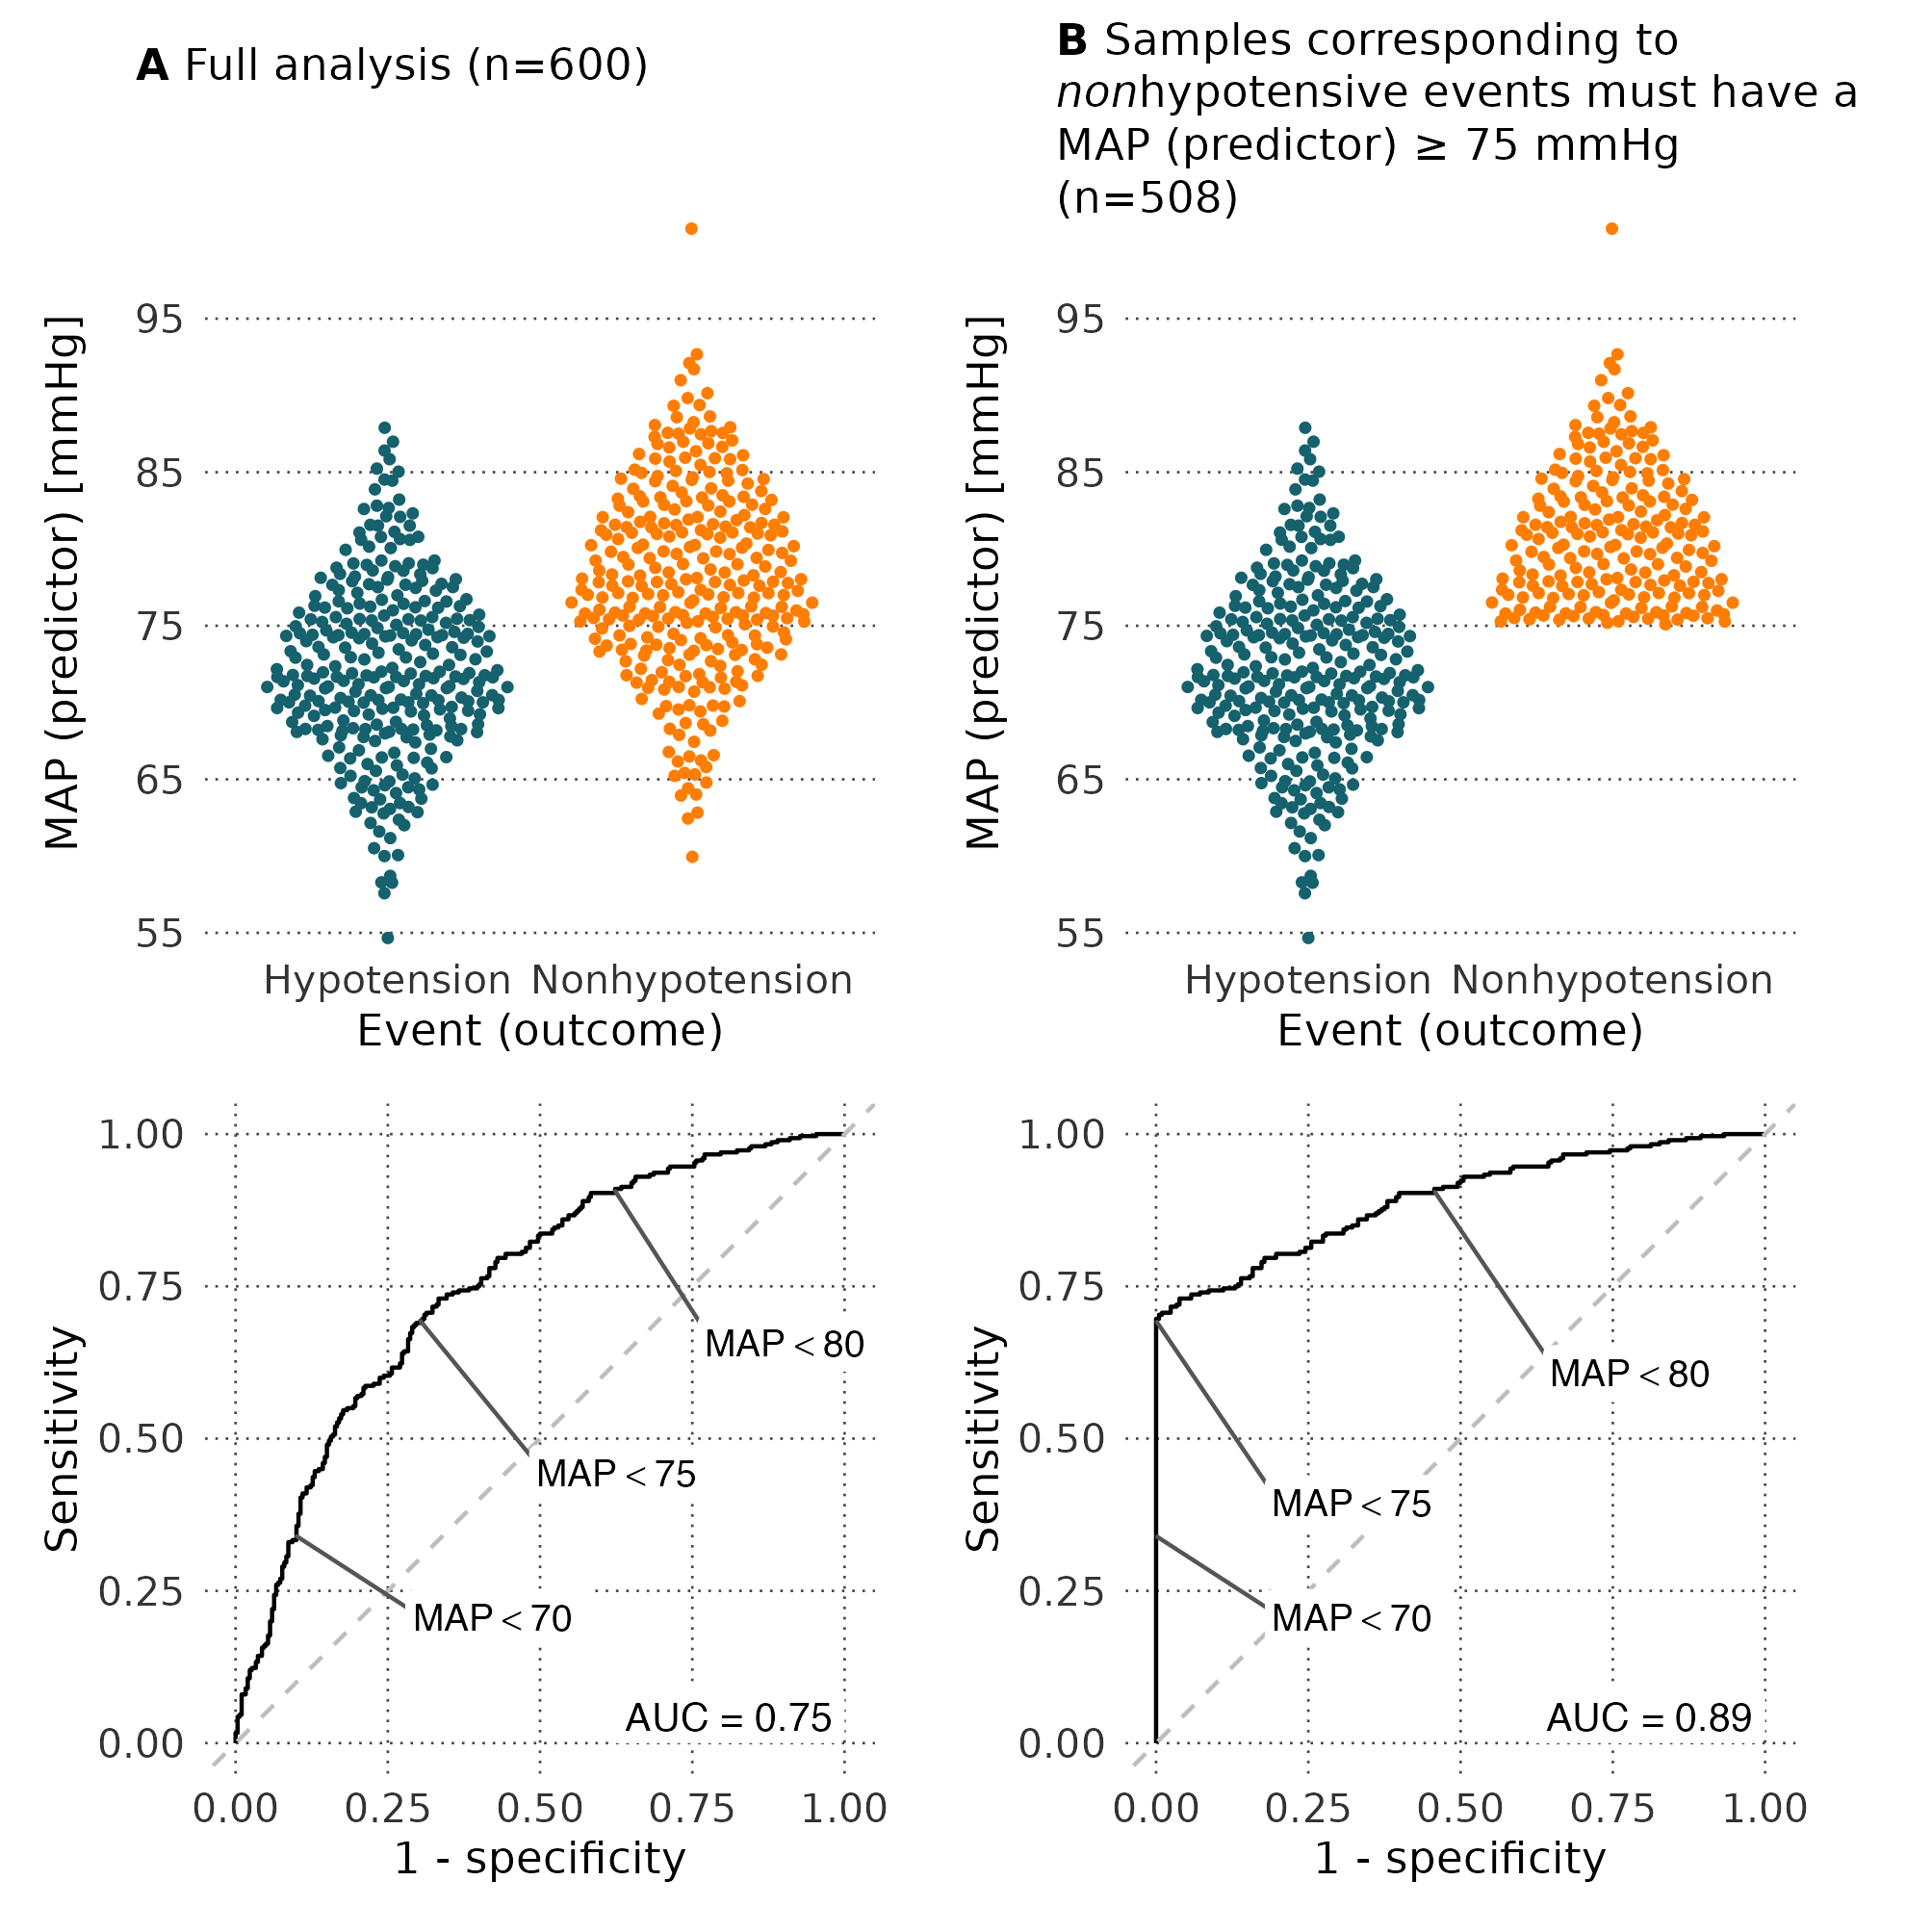
The ROC curve in panel b is skewed towards high specificity, similarly to the ROC curves in the original paper and most validation papers.
Unfortunately, the predictive ability of HPI was not compared to the predictive ability of MAP. Instead, HPI was compared against the change in MAP over 3 min (ΔMAP), which—to no surprise—is not a good predictor of hypotension.
But how should such a model’s predictive ability be validated?
While this bias in the training data has probably flawed the models ability greatly, it is still unclear to us what the best way to measure it’s predictive ability is.
What the clinical wants to know is:
“when the alarm sounds, what is the probability of hypotension in the next e.g. 10 min?” and
"how often is hypotension preceded by an alarm in a reasonable time interval (e.g. 2-10 min).
This is, however, not trivial to code. E.g the HPI comes with a number every 20 second. If it is above 85, an alarm sounds. Should all consecutive HPI values > 85 be counted as separate alarms, or is it only the first? What if drops below 85 and then quickly rises again? is that two alarms, and can they both correctly predict the same hypotensive event?
Comments on the paper, and on the question above, are very welcome.