How should an early warning system be validated?

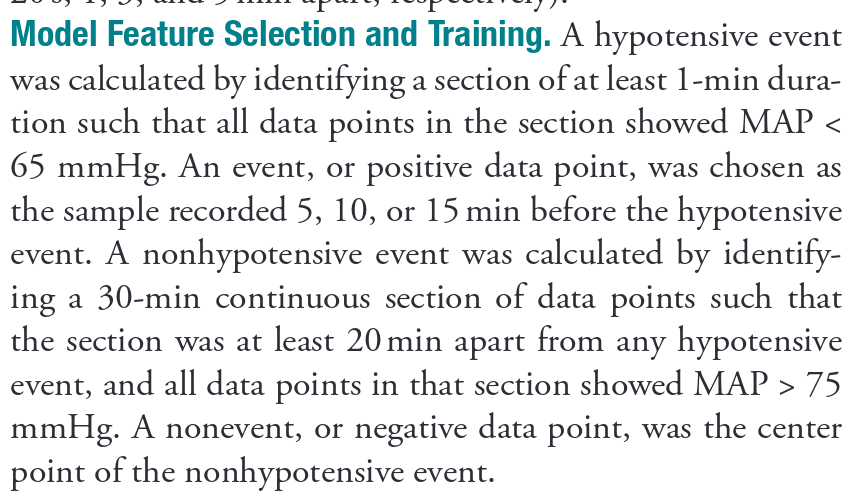
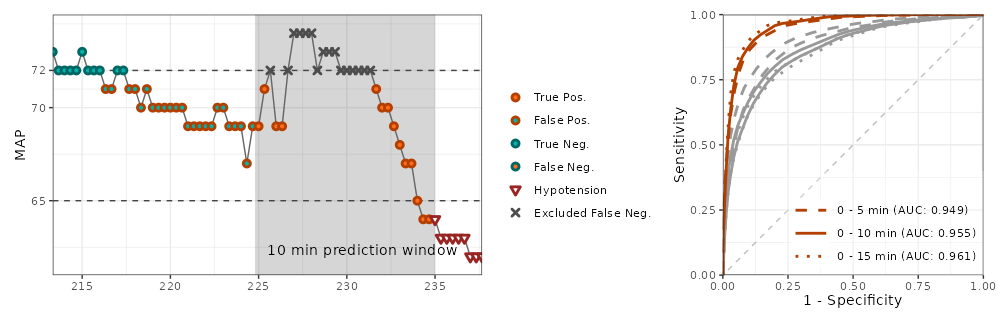
Hypotension prediction index (HPI) is a prediction model (logistic regression) that uses features derived from continuous arterial blood pressure measurements (every 20 sec) to predict hypotension.

The model gives a number (HPI) from 0 to 100 indicating increasing risk of imminent hypotension. By default, an alarm is given when HPI is >= 85.

Say we have a time series with HPI values every 20 sec, and a parallel time series marking each hypotensive event. What would be an appropriate way to quantify HPI’s ability to predict hypotension?

The window of clinically relevant prediction is not well-established, but most would agree that hypotension > 15 min after the prediction is irrelevant.
I think the predictions should be approx. 2-10 minutes before the event (if they are less than 2 min before, it is probably too late to intervene).

Precision and Recall

The best I’ve come up with is to use precision and recall, i.e.:
When HPI gives an alarm, how often does hypotension actually occur, e.g., 2 to 10 min later (i.e., positive predictive value or precision); and when hypotension occurs, was there an HPI alarm 2 to 10 min earlier (i.e., sensitivity or recall)? If the alarm is less than 2 min before the event, it is excluded from analysis.

However, precision and recall has the problem, that it is dependent on the prevalence of hypotension.

ROC analysis

Another that has been used, and seems reasonable to me, is to define a target vector which is FALSE everywhere except for e.g. 2-10 minutes before every event, where it is TRUE. Less than 2 minutes before events and during hypotension is excluded from the target vector. A ROC analysis is performed to show HPI’s ability to classify the target vector.

The model actually does not work, but it has been difficult to convince other researchers

Numerous validation studies have been conduced with different approaches. Most are sponsored by the company selling the model, and the results bear mark of this.
The prediction model actually does not work, due to a selection problem that I have described here earlier: https://discourse.datamethods.org/t/a-major-selection-bias-affects-a-widely-used-model-for-predicting-hypotension/5915

1 Like

Precision, recall, sensitivity, and specific use reverse-information-flow backwards-time conditional. I’d avoid them. Stick to forward predictive mode and things like calibration curves.

1 Like

The model calibration is completely off, since it was developed with a case-control design with all hypotensive events, but only, highly selected, non-representative non-events. However, the company states that the number (HPI) does not represent the risk of hypotension, only that higher numbers are associated with higher risk of hypotension.

Do you have an example of “forward predictive mode”? I can go through each prediction and look forward for a hypotensive event in the window of interest, but I think that’s identical to the ROC analysis using a target vector.

A case-control study cannot form the basis for an alarm system. You’d need to combine that with a cohort study. A forward predictive model is for example a logistic model built on a prospective cohort study.

1 Like

Indeed, but that is, nevertheless, how the model was developed :man_shrugging:

original-paper-methods

A colleague and I pointed out that the method is problematic nearly 2 years ago, and the company has just responded with a new, but still very problematic validation study. I can point out some major problems with their method, but I’m unsure what the “correct” analysis would look like.

Meanwhile, this algorithm is still being sold and used in operating rooms all over the world.

1 Like

Thank you for bringing this discussion. One approach to complex ML algorithms based on time series or threshold sets is to examine the components to detetermine if the ML is simply tracking the dominate single signal with the rest comprising the equivalent of mathematical embellishment.

We saw that with the new Sepsis Scores where Lactate (a nonspecific death signal) was added and then the scores were then validated by prediction of mortality.

Here is an artlcle which suggests the HPI may track the well known predictor of hypotension, the mean arterial pressure, (MAP) itself.

However it is difficult to believe that the upstream values of arterial pressure during complex and prolonged surgery are not potentially predictive of some threshold of hypotension since pathophysiologic instabilty evolves with blood loss and other factors. Of course this requires the proper methodology.

Futhermore the risk of an overly sensitive index would seem to be low so even if it simply detects events which an experienced expert would likely see coming itmight still be beneficial given the different levels of anesthesia delivery experience and competence at the head of the bed. Although there might be the risk of false sense of security.

In the proposal you provide here how is the true window chosen. If hypotension is predicted 12 minutes in advance is this false? Shouldnt there also be some credit for early prediction, for example 7 minutes being better than 2 minutes? Why is a 1.5 minute prediction excluded?

Predicting adverse events from time series data is more complicated then defining a single threshold index and a threshold “True” window (the index itself being a time series). That simplfies the analysis but is too arbritrary and fragile IMHO.

This is the case for HPI, which seems to simply track MAP. The overrepresentation of MAP is caused by a severe selection bias, as we describe here:

The bias caused MAP < 75 to be associated with risk of hypotension in the training and validation data.

Recently, two papers has published comparisons of HPI’s and MAP’s predictive ability, and both find no difference between the two predictors. One paper is the one you mention above. The other is by researchers at the company behind HPI:

Despite showing identical performance for HPI and MAP, they argue for the continued relevance of HPI, claiming that it is not statistically valid to use MAP as a predictor of hypotension (MAP < 65). This is of course nonsense. Using the outcome variable as a predictor is done in practically all forecasting.

There may very well be useful information in consecutive MAP values and features derived from the arterial waveform, but the selection bias imposed during training of HPI made MAP such a good predictor that other potentially useful variables became irrelevant.

I think the problem is mainly over-treatment. Keeping HPI below 85 (the alarm threshold) practically means keeping MAP > 72 mmHg. That may not be harmful, but it is definitely above the more common target of 65. Also, I think it is unethical to sell an algorithm with a promise that it predicts hypotension with high accuracy, if it is practically just a new MAP alarm.

That is indeed the struggle.
If a prediction is 1 hour before the outcome in a surgical setting, I would not consider those related, and I think it should be classified as a false alarm.
In an ICU patient, it might be reasonable to predict hypotension 1 hour in advance.
Also, it is not really useful (nor impressive) to predict hypotension seconds before it occurs. Therefore I think a minimum time for the prediction window is also reasonable.

One approach to overcome the arbitrariness of “11 min before is false alarm, while 9 min before is true alarm” could be to decide on a “window of acceptable alarms” and a “window of expected alarms”.

                                           EVENT
     Time [min]:     -15     -10         -2  0
Accepted alarms:      xxxxxxxxxxxxxxxxxxxxxxx|
Expected alarms:              xxxxxxxxxxxx   |
   Alarm target: -----        ++++++++++++   |
  Actual alarms: ---++++---------++++++++++++| 
    Alarm class: NNNppeeeeeeeennnPPPPPPPPPeee|

N = True Negative
n = False Negative
P = True Positive
p = False Positive

This approach is inspired by the Numenta Anormaly Benchmark, which instead of “expected” and “accepted” windows, weigh alarms differently depending on the time to anomaly.

Back to limitations of case-control studies, the company is on very thin ice and will be unable to estimate error probabilities correctly. You have to supplement the retrospective data with prospective data to get an alarm that has correct forward probabilities.

2 Likes

If there’s actually money to be made from a model that actually works in this area, somebody ought to contact me privately. :money_mouth_face:

3 Likes

Here is an example of how prospective data looks (and the method used to classify each prediction in the new revalidation).

image

The left plot show a time series of a predictor (mean arterial pressure, MAP) 20 minutes before a single hypotensive event. In this visualization, MAP<72 is used as alarm threshold.
The excluded false neg predictions are excluded because there are later true pos. predictions of the same event (at least 2 min. of TP predictions). I assume this is done to make the sensitivity approximate the proportion of events predicted at least 2 minutes in advance.

The right plot is the ROC analysis from counting up these classifications for all relevant thresholds and for a large amount of data.

ROC analysis is not relevant to decision making (it’s for group decision making with a specific utility function), and the results you showed do not provide information on the accuracy of the decision (Pr(outcome | prediction)).

1 Like

Agreed!, I shared to plot to show the “framing” of the problem (multiple predictions per event), and to show the approach used in the current revalidation.

The approach I suggested calculates PPV / Precision, which is Pr(outcome | prediction), (right?)

Yes Pr(outcome | X) or for calibration curve Pr(outcome | predicted outcome). Needs a prospective cohort study or a prospective cohort that is used to calibrate what’s learned from a case-control study.