Critique of a published prediction model

I’m an early career researcher and long-time member of datamethods. I am an MD/PhD from a small country with a very small community of statistical and epidemiological expertise – which means that by necessity, I must do most of my statistical work myself. I have become enamoured with all aspects of clinical prediction modelling, from development to deployment. I and my team recently published a risk prediction model that we intend to extend and validate, and unlike many prediction models, are actively working on getting included into clinical guidelines for general use. Because there exists very little expertise in prediction modelling at my institution (and country) I receive very little critical feedback, neither positive or negative, and I am afraid that my work is not as rigorous as it could be. I wanted to see whether the datamethods community would consider reading my work and providing me with feedback, positive or negative. This could be considered community service, as for better or worse, my models are very likely to actually be used by clinicians and my research career will likely be spent producing them.

The model is described in Development of a Multivariable Model to Predict the Need for Bone Marrow Sampling in Persons With Monoclonal Gammopathy of Undetermined Significance: A Cohort Study Nested in a Clinical Trial https://www.acpjournals.org/doi/10.7326/M23-2540 . I will provide an attachment bellow that includes an early draft of the paper before the editorial process began for those who cannot access the publication through their institution (Edit: the editorial team vetoed this being shared). For a brief background: monoclonal gammopathy of undetermined significance (MGUS) is an asymptomatic precursor to multiple myeloma (MM) and other lymphoproliferative diseases. MGUS is extremely common, roughly 3-5% of adults 50 years of age and older. All individuals with MM are thought to go through MGUS, but the majority of persons with MGUS never progress to MM. MGUS can be diagnosed and much of the determination of the risk of progression can be completed with a simple blood test. However, the proportion of bone marrow plasma cells (BMPC) is also a significant risk factor. If BMPC are ≥10%, this defines an intermediate state known as smoldering multiple myeloma (SMM), which has a higher probability of progression to overt disease, such as MM, and clinical guidelines suggest much more intense monitoring for this group. Bone marrow sampling is an extremely safe procedure, but can be painful and is generally only performed in specialised centers. Our model predicts the probability of ≥10% BMPC (and therefore SMM by bone marrow criteria) based on commonly available parameters to inform the decision to refer persons with presumed MGUS for bone marrow sampling.

The original model was an ordinal logistic model with outcomes 0-4%, 5-9%, 10-14% and ≥15% bone marrow plasma cells and five variables (18 parameters): MGUS isotype (IgG, IgA, biclonal and light-chain, 3.d.f.), M protein concentration (modelled with a restricted cubic spline with four knots, 3.d.f.), free-light chain (FLC) ratio (modelled with a restricted cubic spline with four knots, 3.d.f.), and total IgG concentration (modelled with a restricted cubic spline with four knots, 3.d.f.), IgA concentration (modelled with a restricted cubic spline with four knots, 3.d.f.) and IgM concentration (modelled with a restricted cubic spline with four knots, 3.d.f.).

During the editorial process questions were raised with regards to

  1. using an ordinal model compared to a logistic model (<10-14% compared to ≥10-14%). I justified this in
    MGUS_prediction_ordinal_vs_logistic.html (2.0 MB)

  2. using restricted cubic splines for continuous parameters. We ultimately choose to include total IgG, IgA and IgM as linear variables, justified in
    MGUS_prediction_rcs_vs_linear.html (3.9 MB)

  3. whether total IgG, IgA and IgM should even be included. We justified including these in MGUS_prediction_total_immunoglobulins.html (1.8 MB)

  4. wether interaction terms between MGUS isotype and total IgG, IgA and IgM concentrations should be included. We argued against this in
    MGUS_prediction_interaction_terms.html (3.0 MB)
    MGUS_prediction_interaction_terms_linear.html (3.0 MB)

The clinical calculator is available here. I have requested permission from the editors of Annals of Internal Medicine to attach the manuscript here. Edit: This request was denied. Rmarkdown .html file of all the statistical code was to large to post onto datamethods so I uploaded it to OSF.

Any and all criticism, whether it be wording of the manuscript, methodological decisions, how the code was written or presented, or presentation of the clinical calculator is all greatly appreciated, no matter how pedantic or minimal.
7 Likes

Elias you are doing really excellent work. I’ll start what I hope is a string of helpful thoughts from many datamethods participants.

BMPC is assumed to be captured as a proportion. In other settings, e.g., % PMN cells in blood panels it has been found that absolutes rather than relative cell counts predict bad patient outcomes. Be sure that the same doesn’t happen for BMPC.

In assessing linearity we are more relaxed about retaining nonlinear terms because they do not add complexity or require more variables to be collected. I would put most of the weight on AIC, and by AIC you have a better model with all the nonlinear terms, in terms of out-of-sample prediction. I would definitely not use the all-linear model. A remaining question is whether the strategy at the beginning of Chapter 4 of RMS could be of use in assigning more knots to the apparently stronger predictors.

BMPC is a truly continuous variable and I think it was a mistake to even entertain a model that assumes that a BMPC of 0 means the same thing as a BMPC of 4% or that 25% means the same thing as 15%. Clinicians frequently make the mistake of assume that if you want simple outputs you must have simple inputs to an analysis. This is far from the case. Model BMPC as a continuous ordinal variable and predict the probability of being beyond any desired cutoff on BMPC.

This brings up the question of whether a cutoff of 10% for BMPC has been truly validated. You are assuming that it has, but I would love to see a paper that proves that the actual value of BMPC is irrelevant when it is known to exceed 10%. For a cutoff to be valid, the relationship between the variable and an ultimate outcome must be flat on either side of the cutoff. But whether the cutoff is valid or not, using the cutoff in the primary statistical model is a no-no.

Keep up the excellent work. The way you have asked for input is brave, and I hope it results in an even more rapid trajectory for your research.

3 Likes

Thank you for your kind words and excellent comments! What made me fall in love with prediction modelling is that, unlike many forms of observation research, the research product is created with the intent of direct use by others. Although I always feel responsible for any research I create, I am even more paranoid about a product that will directly inform decision making. I therefore welcome any and all critique to update and refine the research product.

This is a very interesting point that I will have to consider along with my biochemical scientist and haematologist colleagues. My first thought is that for bone marrow samples, unlike peripheral blood, there are large variations in the number of plasma cells depending on where the sample was taken from because bone marrow is more of a solid than a liquid and therefore not as uniform as peripheral blood. Having written this, I fail to see how this makes bone marrow plasma cells as a proportion rather than an absolute count any more robust. I will have to think about this and possibly use our data to try to test this hypothesis.

I freely admit we didn’t consider this and will following this comment. A less interesting but practical reason for us to use BMPC as a proportion is that this is the way it has been used in this literature for the past 50 years. We are already fighting an uphill battle to convince the myeloma community to use a probabilistic model rather than risk groups to inform decision making.

I had a feeling using the linear model would be controversial. Is there no value in simplifying the model for future external validation, in light of external validation cohorts in this space being very small? I will re-read Chapter 4 of RMS.

I agree completely. Unfortunately, the five-percentage point range categorisation was built into the data collection instrument. I could have increased the number of the higher categories (15-19%, 20-29%, 30-39%, etc.). However, these categories included fewer than 10 persons each. I considered that the values of the proportional odds intercepts were likely unstable with these few individuals. Do you know of any guidance on the minimum number of individuals per outcome level to justify retaining the level?

A very perceptive point. The 10% BMPC level has NOT been validated and is indeed continuous as you say, with higher risk of progression as the percentage BMPC increases. Unfortunately, the field of monoclonal gammopathies has suffered from definitional dichotomania for the past 50 years. If an individual previously defined to have MGUS is demonstrated to have ≥10% BMPC on bone marrow sampling, the individual is no longer considered to have MGUS but a whole new condition called smoldering multiple myeloma. Clinical guidelines have different recommendations for MGUS and SMM, and these are generally managed by different clinicians – primary care physicians generally managing MGUS and SMM generally being managed by haematologists. This is what most clinicians are attempting to clarify when they obtain a bone marrow sample. What I was hoping to do is use the proportional odds model to predict all levels of %BMPC at once so that clinicians could make a more nuanced decision based on the probabilities of the various outcome levels. Unfortunately, very few participants had %BMPC in any of the upper outcome levels.

We are collaborating with several large research groups to obtain an external validation cohort. If the model performs well in this cohort, I envision merging the two cohorts to extend the model for higher outcome levels.

2 Likes

In infectious disease, % PMNs was used for a long time before we showed that it had almost no predictive value for bacterial meningitis, and that absolute poly count had major predictive value.

There are at least two ways to test which is better. The best is a direct contest between to two for predicting time to MM. The second is indirect: see which one is more predictable from the variables you are using (which I assume are fully pre-specified).

AIC is a good predictor of which model will perform better.

At least you have it to within \pm 5 percent. By all means don’t make the response variable be cruder than what was collected. You will bias the model, lower power and precision, and get misleading assessments of linearity. For example suppose that within the >10% interval there is a steep slope between age and BMPC. Ignoring BMPC variation within the > 10% interval will dampen that slope.

The minimum number of subjects for an outcome level is 1. Think of how beautifully well a Wilcoxon test or a proportional odds model works on continuous Y with no ties. Nothing is gained in creating ties in the data by combining levels. Intercepts can be unstable just like a histogram can be unstable. And like the stability of an ECDF, the cumulative probabilities in a proportional odds model will be stable no matter how many intercepts there are. You just get instability when trying to estimate \Pr(Y = y | X) for a single y value.

This doesn’t matter. The current model with coarsened data is misleading and inefficient and should not be used for any purpose. Sins of the past should not be perpetuated. It’s time to improve the field. Educate collaborators about the magic that can happen once you have a reliable information-preserving model that can be used to obtain all possible clinical readouts, e.g. \Pr(Y \geq y | X) for 5 different values of y.

1 Like

Our model included the outcome levels 0-4%, 5-9%, 10-14% and ≥15%. However the model is almost entirely evaluated at the ≥10-14% outcome level. The manuscript is written with this level in mind and the suggested use of the model is based on this outcome, including the decision curve analysis. I will post the manuscript immediately when I (hopefully) receive permission from the editorial team.

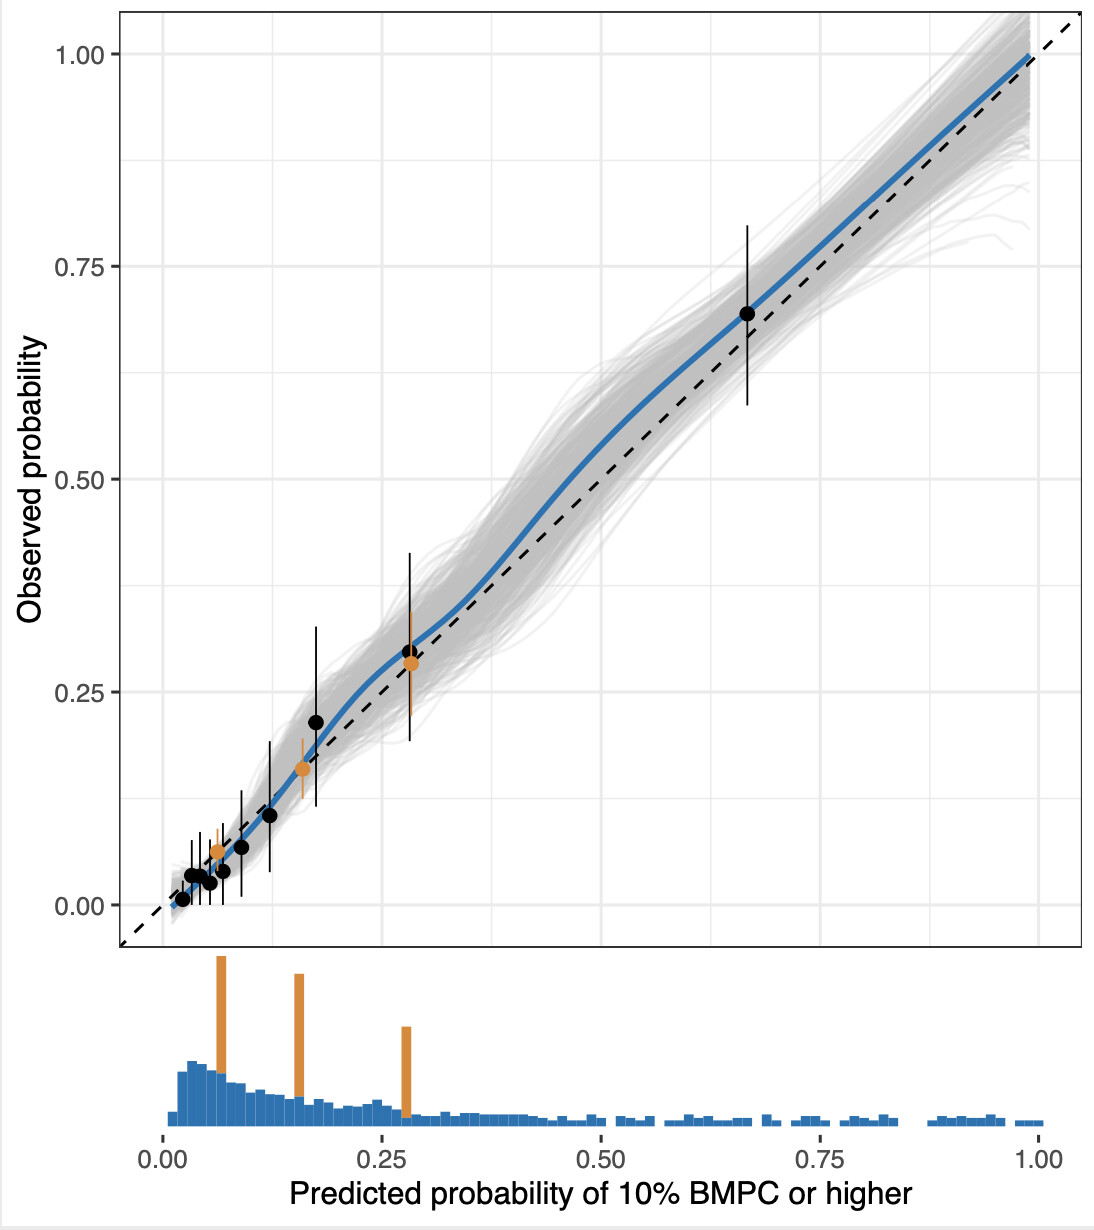
I now understand that introducing ties in the ≥15% outcome level by combining the levels at or above 15-19% is less efficient, reduces power and introduces bias. In the next iteration of this model, when we have collected more data I will correct this and fully use all the outcome levels. However, shouldn’t the cumulative probability for ≥10-14% outcome remain unbiased? The calibration curve seems fairly convincing.

image

Presumably, the only way to be sure is to compare the predictions made by the current iteration of the model, to the model that includes all outcome levels. I will do this over the coming days and post the result here.

Binning Y then predicting \Pr(Y \geq y) where y is one of the bin endpoints may be biased. Take for example a case where binning into an interval [a, b] is done for Y, and most of the observed Y values are more than 0.8 of the way from a to b. The prediction is formed as if Y has a mean of \frac{a+b}{2} when Y \in [a, b]. This is related to an example Andrew Gelman once gave on his blog where for each year a researcher reported the proportion of Y within each of several intervals and concluded the proportions were flat over time. In fact there was a time trend in Y because within some of the intervals there was a change in mean Y, even though Y did not jump to a different interval.

Bigger problems with coarsening data than the type of bias mentioned above may be

  • you have less information to estimate coefficients, so standard errors increase
  • confidence intervals of predictions will be wider
  • you are more likely to mis-measure the relative predictive importance of a predictor
  • model choice, using AIC for example, is less reliable
  • you can’t make estimates of \Pr(Y \geq y) for y that is not one of the interval endpoints used in model fitting. Different readers have different thresholds.

An extreme case of what I discussed above is when the last interval is [b, \infty] and one estimates \Pr(Y \geq b). If all of the Y values in that interval are equal to b, one might think the the probability of a patient having a really bad outcome is high when in fact every patient had a marginal outcome. Incomplete conditioning, i.e., using intervals instead of particular values, causes a number of problems.

2 Likes

I agree with all your points and they have revitalised me to campaign for a full-outcome-level proportional odds model in the next iteration or our prediction model. I will freely admit that I did not realise the bias I was introducing into the higher outcome levels by combining them, and this is an important lesson that I have gained from posting this call for critique on datamethods.

My strategy for this version was designed around its suggested use, which was to inform the decision to obtain a bone marrow sample in individuals with presumed MGUS, based on the probability that this test would reveal the person to have SMM (by bone marrow criteria) rather than MGUS. Based on my own experience, my haematologist colleagues and conversations at the American Society of Haematology conferences from 2021-2023, this is the most common rationale for obtaining a bone marrow sample in individuals with presumed MGUS. Our aim with the model, is to reveal to clinicians how low-yield their current testing strategy and how unlikely it is to change management, with the end goal to decrease bone marrow samplings in the MGUS population. It should be noted that the Mayo Clinic risk stratification model of MGUS has been repurposed for this decision for decades. Our paper is the first to rigorously evaluate the Mayo Clinic model for this purpose, showing our prediction model to be superior for any risk threshold by decision curve analysis. The biases introduced by combining higher outcome levels into the ≥15% BMPC outcome level (the highest in our model) do not effect the recommended use of the model as presented in our online calculator, because the model is exclusively evaluated on the ≥10-14% outcome level.

The rationale for using a proportional odds model even though I only intended this model to be evaluated on one of the outcomes (≥10-14%), was based on statistical efficiency. I learned this from reading Regression Modelling Strategies, 2nd edition and we discussed this here on this forum https://discourse.datamethods.org/t/using-a-proportional-odds-model-instead-of-logistic-model-to-improve-power/7256 . I never figured out how to formally incorporate the efficiency gained from using a proportional odds model rather than a logistic model, so I based the sample size calculation for the prediction model on procedures for a logistic model on the rationale that the proportional odds model is at least as efficient. Informally, I should that for my use, the proportional odds model with four outcome levels was 40% (range 18-80%) more efficient (as shown in the attachment in the original post titled MGUS_prediction_ordinal_vs_logistic.html and the thread I linked to in this comment.

So while using all the outcome levels is more efficient (and I will be incorporating this in future iterations of the model when I figure out how to present the results and justify its use to clinicians), the current model derivation is more than adequately powered/efficient for its intended use.

1 Like

Very well written. I would just add that a less efficient analysis results in parameter estimates, that while not very biased, have a lower probability of being very close to the true values, due to variance inflation.

1 Like

Hi Dr.Eythorsson

I’m not able to comment on the stats involved in your prediction model, but I hope you don’t mind if I ask a couple of clarifying clinical questions (as a family physician who has many patients with MGUS). Sorry if these questions are addressed in your paper (I don’t have access to it).

My understanding (so far);

  • Some proportion of patients classified as having “high risk” MGUS (using traditional criteria) might actually be reclassified as having “smoldering myeloma” if they were to have bone marrow aspiration performed, and if the aspirate were to show >10% clonal plasma cells;

  • Per UptoDate, the rate of progression of high-risk MGUS to MM is 58% over 20 years (and 1% per year over the first 5 years for all-comers with MGUS); the risk of progression of smoldering MM to MM is 10% per year over the first 5 years;

  • Your concern (I think?) is that, given the low absolute annual rate of progression from high risk MGUS to MM, the expected “yield” from performing a single bone marrow aspiration on all patients classified as “high risk MGUS” (in order to not “miss” cases of smoldering MM) would be low (?)

  • The “10% plasma cell” criterion for bone marrow aspiration seems to be based on the observation (from past observational cohort studies) that the vast majority of patients diagnosed with MM have >10% plasma cells on bone marrow aspirate (?)

Questions:

  1. Is the ultimate goal of your prediction tool to highlight the low likelihood that a single bone marrow aspiration, performed at the time of diagnosis of high risk MGUS, will detect an important number of cases of “smoldering MM” cases ?;

  2. Has anyone ever studied a group patients classified as high-risk MGUS to see what proportion would be reclassified as “smoldering MM” with a single bone marrow aspiration?

  3. Is there any trend/push within the hematology community toward performing serial bone marrow aspirations in patients with “high risk MGUS,” with the goal of identifying smoldering MM as early as possible (?) If so, is this because there is strong evidence that treating smoldering MM improves outcomes (i.e., reduces the incidence of end organ damage and improves overall survival) ?

2 Likes

From my perspective, the clinical area of MGUS and SMM is a bit of a mess. Essentially, we have asymptomatic precursor conditions that do not seem to cause any problems until they progress to true symptomatic disease. Importantly, most people with MGUS (and even SMM) never progress to true disease during their lifetime. Therefore, the management and follow-up of MGUS and SMM are essentially prediction problems.

Complicating all of this are the decades of literature on the risk of progression of both MGUS and SMM using severely dichotomised risk group approaches, which have been baked in to their definitions and clinical guidelines. MGUS was categorised into risk groups based on several publications in the early 00’s. This approach defined “risk factors” as M protein concentration ≥15 g/L, non-IgG MGUS (IgA, IgM) and free light chain ratio <0.26 or >1.65. If none of these “risk factors” were present, this was defined as low-risk MGUS, if any one “risk factor” was present this was defined as low-intermediate risk, if any two were present then high-intermediate and if all three were present this was considered high-risk MGUS. The readers of datamethods will easily identify huge problems with this approach. Importantly, in the cohort that was used to create these risk groups, most individuals had not undergone bone marrow sampling, and therefore many had SMM without this being known or taken into consideration.

SMM is similarly categorised into risk groups. The publication describing the risk group approach for SMM actually also contains an excellent score model that uses much finer categorisations of the predictor variables and is actually quite good, but this is buried in the main text and is not included in the abstract or conclusion, which both only mention a similar risk group approach as is with MGUS: M protein concentration ≥ 20, free light chain ratio ≥ 20 and bone marrow plasma cells ≥20%. If no risk factor is present, then low-risk SMM; if one then low-intermediate risk and so on.

The risk factors and risk groups for both MGUS are mostly based on the same variables. An individual who is high-risk MGUS is almost certainly intermediate or high risk SMM if it turns out that they have SMM by bone marrow criteria, similarly and individual with low-risk MGUS is almost certainly low-risk SMM if they have SMM by bone-marrow criteria. Guidelines provide different recommendations for each of the categories of MGUS and SMM; mostly about the intensity of follow-up and what diagnostic studies should be obtained. They are almost exclusively based on expert opinion. However, there has been a trend towards treating high-risk SMM in the last decade based on two RCTs that found a longer time to progression to MM, and in one study an overall survival benefit. Guidelines recommend that all persons with MGUS should undergo bone marrow sampling except those with low-risk MGUS. The justification for this was that within the low-risk MGUS group, only 5% were found to have ≥10% bone marrow plasma cells in cohort studies.

This is the background I felt I needed to provide to discuss the clinical aspects of the model. It is may opinion that the current risk group approach is not useful to clinicians. How exactly does it help me to know if the 20-year risk of progression is 5% (low-risk MGUS), 21% (low-intermediate MGUS), 37% (high-intermediate MGUS) or 58% (high-risk MGUS)? How should a 20 year risk change my management now? MGUS is such a common condition that we need evidence based follow-up and this model is the first of many steps our group wants to take in that direction. Or group has conducted a 75000 person screening study for MGUS which identified roughly 3600 individuals with MGUS (three times larger the largest cohort to date that was used to define the risk categories) and randomised these to one of three arms of different follow-up strategies (one of which included no follow-up and no report of the individual having MGUS). Over the coming years, we aim to understand how MGUS progresses and which parameters predict progression to MM and other disease. Along the way, we want to publish useable prediction models that can inform the clinical decision that are being made along the way.

Having identified an individual with MGUS, one is faced with a decision: would my management change if bone marrow plasma cells ≥10% and what is the probability that bone marrow plasma cells ≥10%. Our model answers the latter and we are refining the presentation of the results in the clinical calculator to help clinicians answer the former. In further iterations of the model that include all possible outcome levels, I envision to summarise the results as the predicted probability that the person has SMM, and the predicted probability that the person has a particular % risk of progression based on the score based risk prediction model for SMM. The M protein concentration and free light chain ratio will already be known and the predicted probability of various bone marrow plasma cell percentage will be the last variable needed for the score model of SMM.

As you can see, the landscape is extremely complicated. In our publication, we show that our approach leads to fewer bone marrow samples for any acceptable low-risk threshold for ≥10% bone marrow plasma cells, compared to using the previously accepted risk group approach to inform decision making. We have to work within the framework that has been built and excepted into guidelines over the past couple of decades.

I sent you a direct message that may interest you

3 Likes

Hello! If we do bone marrow biopsy on all patients with MGUS and don’t rely on probabilities, is that a problem? Why do you think so? I sent you a personal message.

My patients become very anxious when a specialist suggests a bone marrow biopsy for any reason- sometimes they tell me about their anxiety, not the specialist. And it hurts. And the ratio of patients with MGUS to myeloma in my (largely geriatric) practice is very high. If the overwhelming majority of bone marrow biopsies performed in patients with MGUS are not expected to identify a condition for which outcomes would be expected to improve with treatment (?SMM), then why would we do the biopsy in the first place (vs e.g., simply repeating lab testing in a year or monitoring clinically for CRAB criteria) (?)

2 Likes

Precisely! My hope is that using our model, which outputs the continous probability of finding more than 10% bone marrow plasma cells, and therefore SMM by bone marrow criteria, can be used to inform a discussion with the patient of the goals of obtaining the bone marrow sample. It “forces” one to speak of what one is aiming to achieve with this test and what one consideres an appropriate low-risk threshold, below which obtaining a bone marrow sample would not be considered worthwhile. Having a 5% predicted risk of 10% or greater bone marrow plasma cells might be above the risk tolerance of a young individual and at the same time a 40% predicted risk of SMM might not be enough for an older frailer individual to feel it worthwile. Some more, especially in the geriatric population, would not consider a screening bone marrow sample worthwhile at any risk threshold and would not even have this considered.

2 Likes

A bone marrow sample is safe and is associated with only rare complications. Most (70%) experience little pain. This is all true. However it requires an additional visit to specially trained staff - normally at specialised centres. You usually miss a day of work and of course pay for this procedure. Finally, many people to experience moderate to severe pain although this is not the norm. Now, the above may be worthwhile if it is likely to lead to a change in management, either more intensive follow-up or even treatment.

In our prospective population-based screening study of MGUS, we identified roughly 3500 individuals with MGUS, of which roughly 2500 were actively followed. Their median risk of having 10% bone marrow plasma cells or greater on bone marrow sampling was 6.7%. If you would obtain a bone marrow sample on all these individuals indescriminetly, you would perform 17 unneccessary procedures for every one procedure that changed management (i.e. found 10% or great bone marrow plasma cells).

However, if you for example used our model and generally believed a bone marrow sample not to be worthwhile unless the risk was 5% or greater, you would refrain from ordering a bone marrow sample in roughly 40% of individuals with MGUS (if the distribution of risk in your cohort is similar to ours). Of those who you obtain a bone marrow sample in, the probability of finding individuals with SMM is now vastly greater, at roughly one in every eight (only seven unneccessary samples). If you were to use a threshold of 10% predicted risk, you would refrain from ordering a bone marrow sample in roughly 70% of all individuals with MGUS, and one in four would be positive.

For any risk thresholds (other than <1.0%, which you are preposing), our model outperforms the strategy of obtaining a bone marrow sample in all indiviudals with presumed MGUS on decision curve analysis.

2 Likes

Ok, I agree with your explanation! But a false negative result is more dangerous than just a bone marrow biopsy. The model will not have 100% accuracy, so we can miss the myeloma diagnosis in even one patient among 100 relying solely on the low risk according to the model. Maybe we should also ask for a patient’s opinion with MGUS.

I’m in favour of patient-centred decision-making, but only if the options being presented are all defensible… A single bone marrow biopsy would be an isolated “snapshot” of a (usually) indolent condition. If the rationale used to justify (or offer) an initial biopsy were that “you never know” which MGUS patient might actually have SMM, then, given the fact that there would be nothing stopping a patient with an initial reassuring biopsy from progressing to SMM from one year to the next, you’d have to be prepared to tell the patient whether (and why) you would or would not offer him serial biopsies (e.g., annually or every few years)…Considering the relatively high prevalence of MGUS, is it realistic or sensible for us to offer to subject so many patients to regular bone marrow biopsies for a condition that, for the vast majority, will never progress in their lifetime (?) Arguably, the answer is “no.” To this end, it seems much more logical to try to develop better tools to predict which patients’ biopsies are most likely to show SMM, and, perhaps, to continue following the rest non-invasively (if at all, depending on their context).

1 Like