Individual response

An intriguing post on Twitter by Judea Pearl linked to a blog written jointly with Scott Mueller Personalized Decision Making . The blog stated

“The purpose of this note is to clarify the distinction between personalized and population-based decision making, the former concerns the behavior of a specific individual while the latter concerns a subpopulation resembling that individual.”
A hypothetical example was then given of data obtained from two randomised clinical trials (RCTs) and a further observational study (ObS). It is not clear what the control was supposed to be in the RCTs but I think one may assume it was placebo. In addition to outcome and treatment, either assigned (for the RCTs) or available (for the ObS), there was information on the sex of patients and whether treatment was taken or not. The RCTs had perfect compliance but in the ObS only 70% of males and 70% of females took the treatment.

In the RCTs the treatment effect (average difference in outcome between treatment and control groups) was identical for males and females and equal to 0.28. The blog states

“every patient, be it male or female, should be advised to take the drug and benefit from its promise of increasing by 28% one’s chances of recovery”

The blog then adds

“Strangely, a detailed analysis of the observational study revealed differences in survival rates of men and women who chose to use the drug. The rate of recovery among drug-choosing men was exactly the same as that among the drug-avoiding men (70% for each), but the rate of recovery among drug-choosing women was 43% lower than among drug-avoiding women (0.27 vs 0.70). It appears as though many women who chose the drug were already in an advanced stage of the disease which may account for their low recovery rate of 27%.”

To cut a long story short, the blog then goes on to claim that this information may be used to identify that the drug is harming some men (strangely not some women) although benefitting other men and that this is important information. Details of the calculations are not provided although various papers are cited. In some of the Twitter exchanges that were made about this, the claim was made that the observational study had the advantege of revealing important features an RCT could not.

(In my opinion the example is not well described on the blog but if my interpretation is at fault, then no doubt others, and perhaps even the authors, can correct it.)

In connection with this I have the following comments (C) and questions (Q).

  1. C Note that a 3-way interaction treatment by sex by compliance is being discussed as being important even though the 2 way interaction of treatment by sex is zero. This is unusual and not particularly plausible.
  2. C An RCT is, of course, capable in principle of investigating treatment by covariate interactions of any order provide that we know what covariates to measure and investigate. There are two major problems a) lack of precision b) assignment of causality. As an example of the latter consider the case where the effect of treatment varies causally by bodyweight but we don’t realise this, We notice instead a treatment by sex interaction. Acting on this will improve prescription but we shall still treat small men and large women sub-optimally.
  3. Q In view of point 2, what does the observational study bring that an RCT could not? The only thing I can think of is that the non-compliance is a sort of natural experiment. Something similar was used, for example. by Efron and Feldman (1991) to elicit dose response using non-compliance.
  4. Q Is it essential for the method to work that subjects are exchangeable between studies? This is never assumed in RCTs since we apply concurrent control. Indeed, all modern work on using historical controis makes an allowance for the fact that control group outcomes will vary from study to study. This would apply a fortiori when moving from RCT to ObS. Note that you cannot force compliance in an RCT, Therefore if the RCT has 100% compliance and the observational study has 70% compliance one could argue that it is likely that subjects are different.
  5. Q Is it in fact essential to have individual causal effects? Of course we would love to have them but time and again we are faced with having to make the best decision we can in the face of imperfect information. Claiming that individual effects are essential is vulnerable to infinite regress. Whatever effect modifier you have found you can always suppose that others will exist.
11 Likes

im not sure what the obs study reveals regarding compliance is useful, and with all the talk of reproducibility it seems odd to fixate on compliance and ‘real world data’ which are so malleable. Re compliance: the value of itt v pp within the trial motivated the sponsor to limit non-compliance. Can the move towards intercurrent events and estimands relax this? I’m unsettled by the slow easing of rigour, touting obs studies over RCTs etc. It’s worth noting how fond industry is of ‘data science’ (funding new data science institutes with massive sums) in contrast with the in-house statistician who was often regarded as a necessary evil (because they were so instransigent and adhered to established guidelines). The new Bennett Institute for Applied Data Science at Oxford Uni announced “The Institute will aim to develop and implement new methods and tools to make data and evidence more impactful in the world.” Read from that what you will

4 Likes

You might benefit from taking a look at chapter 53 of my free open source book “Bayesuvius” where I discuss in gory but entertaining mathematical detail Judea Pearl’s theory of personalized medicine. (trivia: My book’s name is a portmanteau of Bayes and Vesuvius. Revered Bayes studied at Uni of Edinburgh)

1 Like

Thanks. Does it give the answers to my three questions? Note, however, that there are ground for believing that the scope for personalised medicine may have been exaggerated. See, for example Responder Despondency and Pitfalls of Personalised Medicine

Thank you @stephen for that very helpful summary. I hope that a discussion on the topic will be easier to conduct and follow here on ‘datamethods’ than on Twitter, which left me struggling to follow trains of thought! My perspective will be that of a physician applying information from RCTs to patients.

The first thing I noted was that we were only given the risk difference (RD) of 0.28 arising from the two RCTs. I will use this as the effect measure for different severity of illnesses in the rationale below. We were not given the risk or probability conditional on placebo or treatment in the RCT, which makes the situation somewhat different for those who normally use different effect measures such as odds ratios or risks ratios.

Patients recruited into a RCT would typically fall into a specified range of disease severity - not too mild so that very many would recover anyway on placebo and not too severe that few recovered on placebo or treatment. However, this would not be the case in an observational (e.g. post-marketing) study on larger numbers to detect rarer adverse effects, where the treatment would typically be offered to patients with a wider spectrum of severity than these recruited into a RCT but where the same effect measure (e.g. a RD of 0.28) might be applied. This RD of 0.28 is the difference between the heights of the parallel straight lines in Figure 1.

It would thus appear that when some men were offered this treatment in the observational study, the mildness of their illness did not motivate them to take it and the recovery rate was 70% on no treatment (or placebo for such patients in the RCT). These are patients A in Figure 1. The same applied to the women with mild illness who refused the treatment and had a recovery rate of 70%. These are patients B in Figure 1. However, the men whose symptoms were more severe may have accepted the treatment and instead of a recovery rate of about 42% on no treatment / placebo, by accepting the treatment they had a recovery rate of 42+28 = 70%. These are patients C in Figure 1. However, the more stoic women who accepted the treatment only when they had a much more severe illness than the men with an expected recovery rate of ≤0% on no treatment /placebo, with treatment, only 27% recovered. These are patients D in Figure 1.

The message from a physician applying information from a RCT is that illness severity is very important to patients and their doctors. It has always been a part of traditional personalised medical practice. Much information on illness severity can be collected during the recruitment phase of RCTs (e.g. JRAAS 2004;5: 141–5; https://onlinelibrary.wiley.com/doi/10.1111/jep.12981 but can also be augmented during subsequent observational studies.

6 Likes

I think it does answer your questions, although not directly. A few things to keep in mind: Pearl’s personalized medicine theory gives bounds on conditional ATE (using the language of Rubin) or conditional PSN (language of Pearl). The tightness of those bounds depends on what assumptions one is willing to make. Of course, once one makes those assumptions, there are ways of testing their plausibility. The strongest assumptions are assuming a model (i.e., a DAG). Assuming a DAG will sometimes lead to the bounds collapsing to a single point, in which case one says the conditional ATE or PSN is identifiable. Finally, let me stress that assuming a DAG is a testable hypothesis. It’s the hypothesis stage in the Scientific Method. As such, it can and is meant to be tested. A DAG is not uniquely determined for a physical situation, it can be tested to see how good a fit it is, both as a fit to the data, and as a fit to the underlying causal mechanism. In fact, my book has a chapter entitled “Goodness of Causal Fit”. Also, note that RCT are perfect in theory, but seldom perfect in practice. One can do tests to see if an RCT suffers from selection bias. Pearl has a method for removing selection bias from a RCT, if one assumes a DAG. This is described in the chapter entitled “Selection Bias Removal”. The chapters in my book are in alphabetical order by title, and can be read or skipped in a myriad orders, according to taste.

Thanks, Huw. That is very helpful, I shall study this and ponder the implications, However, it would be helpful to have confirmation from Pearl and Mueller that they agree with my and your summary.

2 Likes

Thank you for inviting us to participate in the Data Methods discussion on “individual response”. Judea and I have written the text below. It consists of 3 parts: (1) A more detailed description of the example presented in our blog, (2) An explanation why we believe it brings personalized medicine closer to reality and (3) A discussion of the practical issues raised by @Stephen.

Before we start, let us reiterate the conceptual outline of our theme. We are interested in estimating an individual response to a given treatment, namely, how an individual would react if given treatment and if denied treatment, and we have at our disposal population data, namely, how various subpopulations behave, on average, under treatment and control, including behavior under non-experimental conditions. We are asking: to what degree can population data inform us about an individual response.

The fact that ordinary RCTs, even conducted under ideal conditions, cannot provide sufficient information about an individual response can be seen from the following simple example:
Preliminary Example
Suppose we find no difference between treatment and control groups. For example, assuming our treatment is a drug and our outcome is survival or death, we find that 10% in both treatment and control groups die, while the rest (90%) survive. This makes us conclude that the drug is ineffective, but also leaves us uncertain between (at least) two competing models:
Model-1 – The drug has no effect whatsoever on any individual and
Model-2 – The drug saves 10% of the population and kills another 10%.

From a policy maker viewpoint the two models may be deemed equivalent, the drug has zero average effect on the target population. But from an individual viewpoint the two models differ substantially in the sets of risks and opportunities they offer. Model-1 is useless but safe. Model-2, however, may be deemed dangerous by some and a life-saver by others.

Assume, for the sake of argument, that the drug also provides temporary pain relief. The drug of Model-1 would be deemed desirable and safe by all, whereas the drug of Model-2 will scare away those who do not urgently need the pain relief and aren’t comfortable with the knowledge that there’s a chance (10%) of the drug killing them, while offering a glimpse of hope to those whose suffering has become unbearable, and who would be ready to risk death for the chance (10%) of recovery. (Hoping, of course, they are among the lucky beneficiaries.)

This simple example allows us to illustrate the main theme of our blog post: Supplementing the RCT with an observational study on the same population (conducted, for example, by an independent survey of patients who have the option of taking or avoiding the drug) can help us decide between the two models, thus shedding light on individual behavior, and allowing us to reach conclusions we could not have reached on the basis of the RCT study alone. Indeed, consider an extreme case where the observational study shows 100% survival for all option-having patients, as if each patient knew in advance where danger lies and managed to avoid it. Assume further that a non-zero fraction of patients in the RCT control arm die. Such a finding, though extreme and unlikely, immediately rules out Model-1 which claims no treatment effect on any individual. Such a model could not explain why surveyed people, similar to those who die under control, would survive upon choosing to avoid the drug. Using the RCT study alone, in contrast, we were unable to rule out Model-1, or even to distinguish Model-1 from Model-2.

Now, that we have demonstrated conceptually how certain combinations of observational and experimental data can provide information on individual behavior that each study alone cannot, we are ready to go to the example in our blog post which, based on theoretical bounds derived in (Tian and Pearl, 2001), establishes individual behavior for any combination of observational and experimental data and, moreover, demonstrates critical decision making ramifications of the information obtained.

Part 1

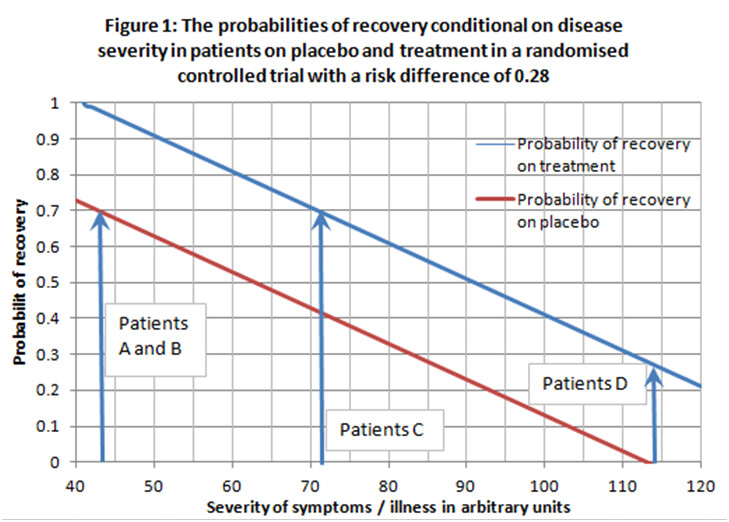
Our example describes three studies, two experimental and one observational. Let’s focus on the second RCT, since the first was used for drug approval only, and its findings are the same as the second. The RCT tells us that there was a 28% improvement, on average, in taking the drug compared to not taking the drug. This was the case among both females and males which we can express as: CACE(male) = CACE(female) = 0.28, where CACE stands for Conditional (or Gender-Specific) Average Causal Effect, defined in Eq. (2). The table below provides survival and recovery data under both experimental and observational settings for women and men. Let us denote yt as recovery among the RCT treatment group and yc as recovery among the RCT control group. The causal effects for treatment and control groups, P(yt|Gender) and P(yc|Gender), were also the same1, so no differences were noted between males and females.
Female Treatment Control Choose
do(Drug) do(No Drug) Drug No Drug
Survivals 489 (49%) 210 (21%) 378 (27%) 420 (70%)
Deaths 511 (51%) 790 (79%) 1,022 (73%) 180 (30%)
1,000 1,000 1,400 600
Male Treatment Control Choose
do(Drug) do(No Drug) Drug No Drug
Survivals 490 (49%) 210 (21%) 980 (70%) 420 (70%)
Deaths 510 (51%) 790 (79%) 420 (30%) 180 (30%)
1,000 1,000 1,400 600

We are treating this as an ideal RCT, with 100% compliance and no selection bias or any other biases that can often plague RCTs. We choose to analyze an idealized RCT in order to better conceptualize how an observational study can provide insight for better decision making. Imperfections will be discussed in Section 3 of this post once the conceptual underpinnings are solidified.

In addition to the above RCT, we posited an observational study (survey) conducted on the same population. For the sake of demonstration, we can imagine that the drug was offered at retail stores without a prescription and consumers were freely able to choose whether to take the drug or not. Since the RCT showed a 28% improvement for both men and women, a public recommendation would naturally be issued for everyone suffering from this illness to use this drug for its remedial effects. In the observational study, however, it was found that 70% of men and 70% of women chose to take the drug, while 30% of both men and women avoided it, possibly deterred by side effects or rumors of unexpected deaths. See Table 1.

With this in mind, the observational study could also be considered an RCT with 100% of participants in the trial, 0% of participants receiving a placebo, and 70% compliance among both men and women, as was suggested by @Stephen. However, we prefer not to think of observational studies in that way, since the literature on non-compliance does not provide us with the tools to combine information from two different studies and leverage it to predict individual behavior. Such tools are provided by the theory of Structural Causal Models (Causality 2009) which led to the bounds of (Tian and Pearl, 2001) and in which “non-compliance” is not a variable, but a manifestation of some unobserved factors, such as “side effects” of “rumors of unexpected death”.

An important assumption underlying our analysis is that of “exchangeability”, also known as “consistency” (Pearl, 2010). In other words, we assume that the units selected for the observational study represent the same target population and that their response to treatment is purely biological, unaffected by their respective settings. Using our notation, consistency implies2:
Y_x = Y \text{ whenever } X = x \text{ and } Y_{x'} = Y \text{ whenever } X = x'

In other words, the outcome of a person using a drug is the same regardless of whether that person took the drug by free choice or by virtue of being assigned to the treatment group in a RCT. Similarly, if we observe someone avoiding the drug, their outcome is the same as if they were in the control group of our RCT. In assuming consistency, we are treating this as an ideal observational study so we can conceptualize the vital insights gained for decision making. Deviation from consistency, normally attributed to uncontrolled “placebo effects”, should be dealt with by explicitly representing such factors in the model.

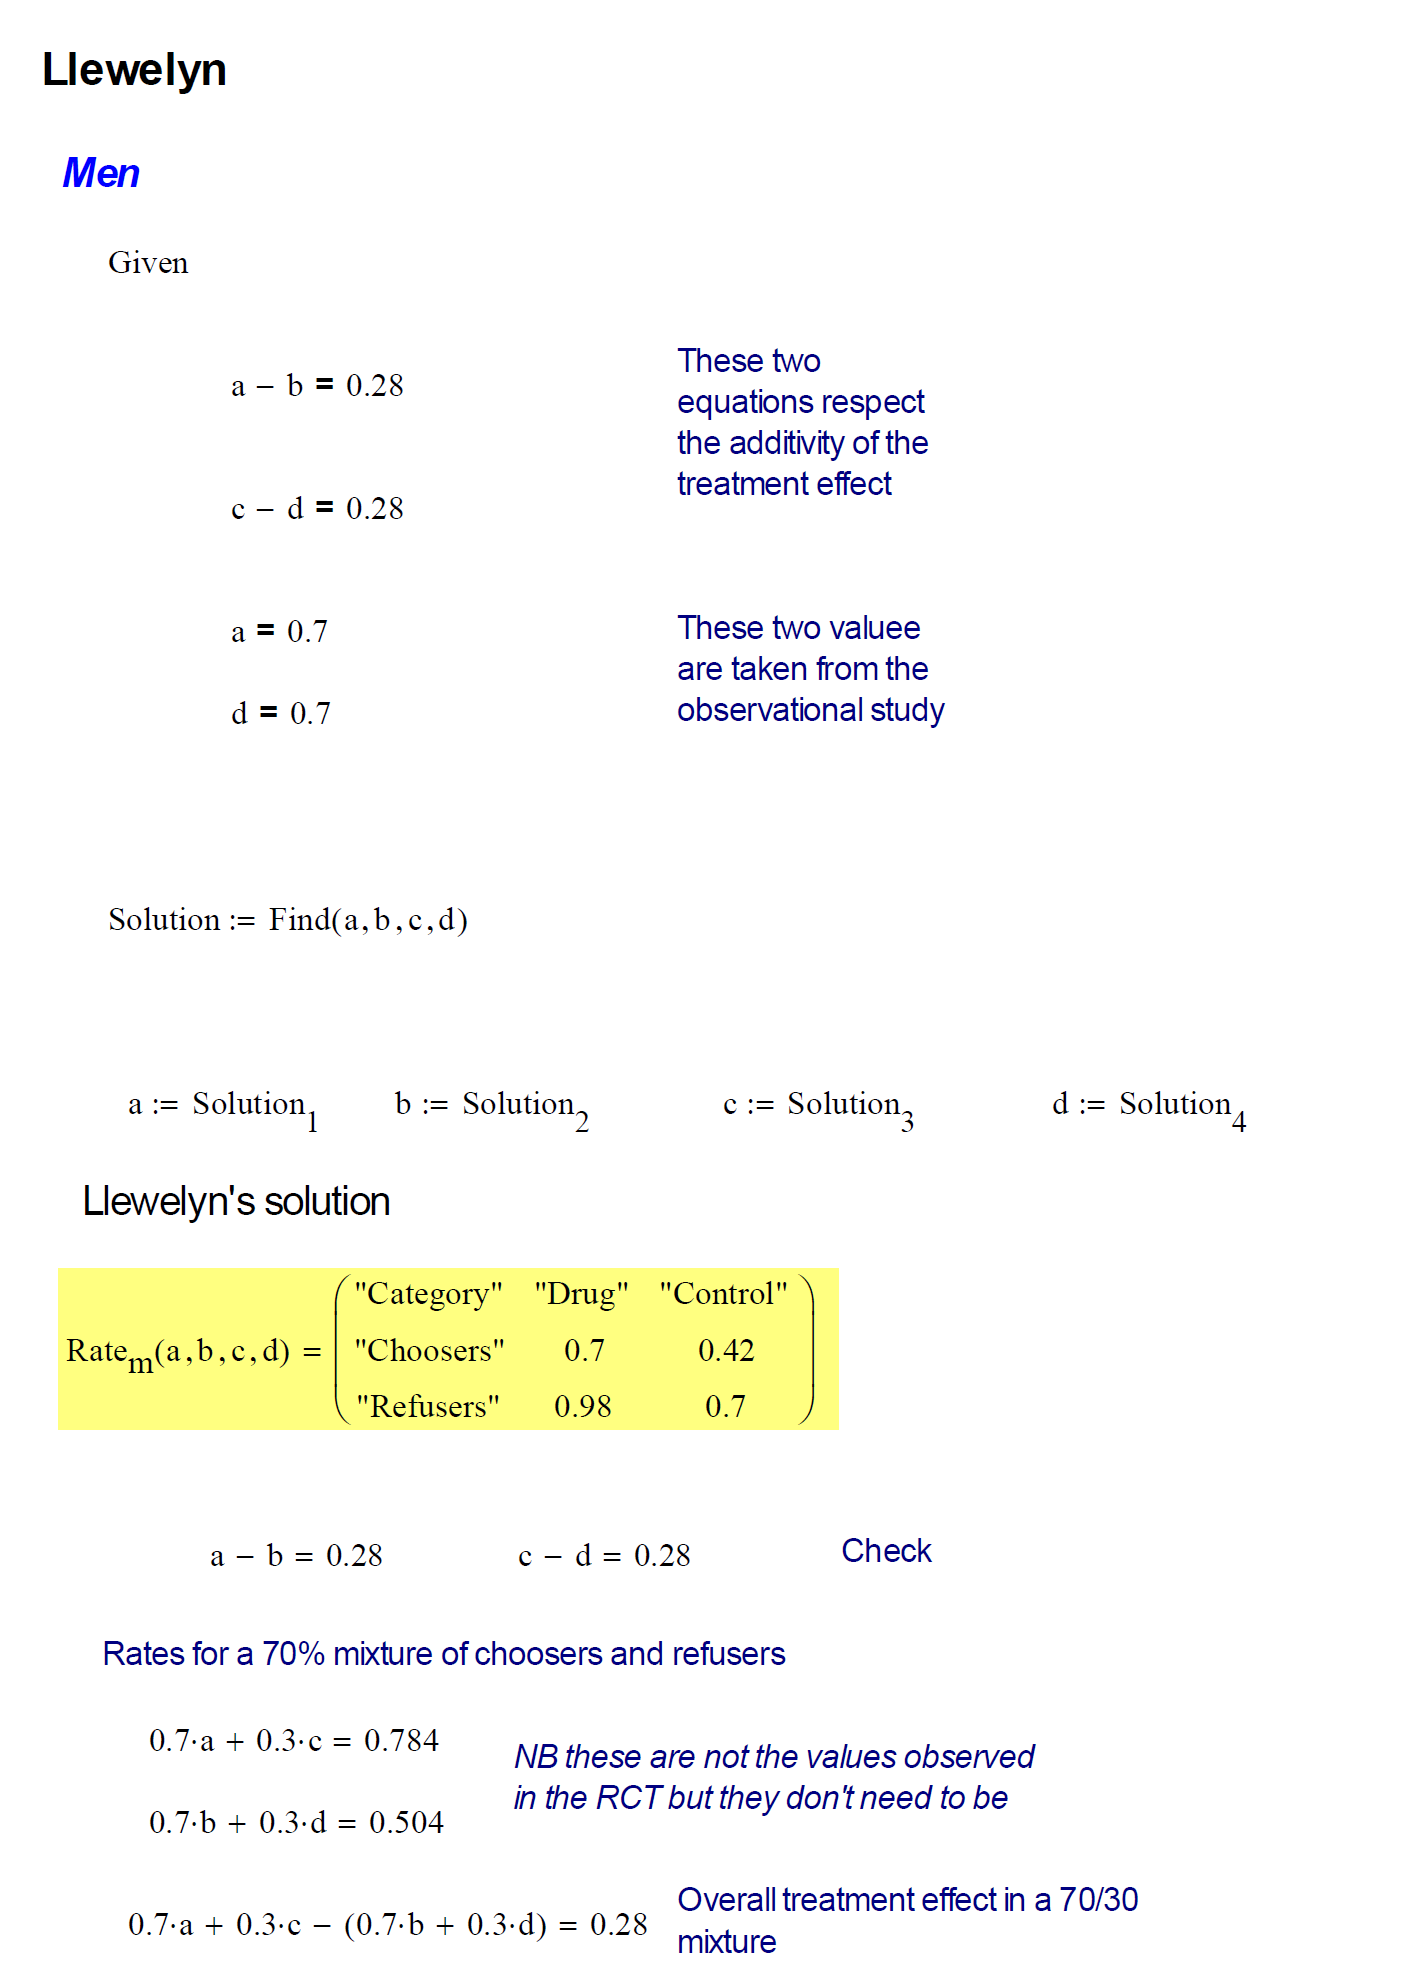
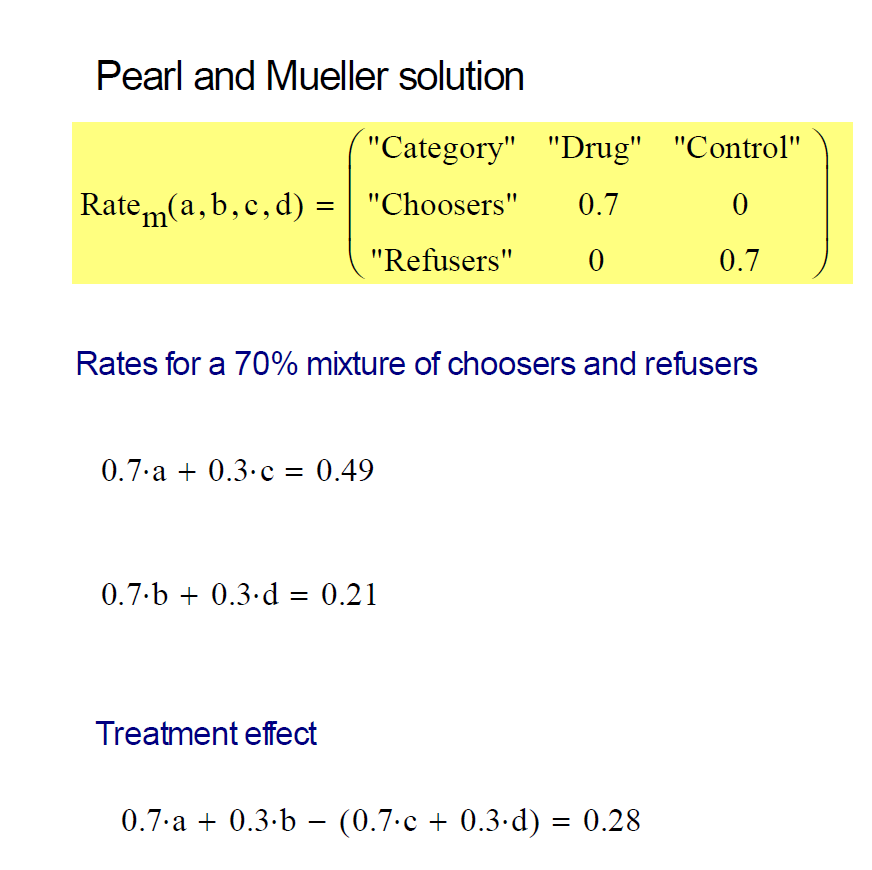
Even though men and women reacted the same according to the RCT, we see in Table 1 that their results are different in the observational study. Among the men and women who avoided the drug, the results were the same, 30% of them died, while 70% of them recovered. However, the results differed among the drug-takers (consisting of 70% of men and 70% of women). Here, 70% of the drug-taking men and only 27% of the drug-taking women recovered. This may seem surprising, since everything else up until this point was the same between men and women. This scenario might seem implausible, but the underlying numbers are realistic and this is a completely possible situation. It is quite plausible that women, unlike men, had a reason (say a side effect) to avoid the drug and chose to take it only when they were at a more advanced stage of the disease.

Remarkably, this observational result of only 27% recovery among drug-choosing women versus 70% recovery among drug-avoiding women, yields crucial decision making information unavailable from the RCT alone. We can now be sure that women, on average, face precisely a 28% chance of benefiting from the drug, and no danger of being harmed by it3. This means that 28% of women will recover with the drug and not recover without the drug, and no woman is in the situation of recovering if and only if she does not take the drug. Naively, we would expect this result given the CACE(female) = 0.28 result from the RCT, if we assume that no woman can be harmed by the drug. This assumption turned out to be correct for women, but not for men. 49% of men will benefit from the drug, which makes men seem to fare better from the drug. But this is balanced by the fact that 21% of men will be harmed by the drug. This means that 21% of men will not recover with the drug and will recover without the drug. This changes the scenario for men as explained in the blog article.

Part 2

The ramifications of these findings on personal decision making are enormous. First, they tell us that the drug is not as safe as the RCT would have us believe, it may cause death in a sizable fraction of patients. Second, they tell us that a woman is totally clear of such dangers, and should have no hesitation to take the drug, unlike a man, who faces a decision; a 21% chance of being harmed by the drug is cause for concern. Physicians, likewise, should be aware of the risks involved before recommending the drug to a man. Third, the data tell policy makers what the overall societal benefit would be if the drug is administered to women only; 28% of the drug-takers would survive who would die otherwise.

.
Fourth, we can go further and examine what we can do with the women and men who chose not to take the drug. Given that they haven’t yet taken the drug, is it worth convincing them to take it? By asking this question we assume, of course, that convincing them implies they did not recover from the illness and are still alive to benefit from being convinced. Accordingly, let us assume that non-recovery does not mean death and changing one’s mind does not affect one’s response. It turns out that if a woman chose not to take the drug and she did not recover, then it is certain that she will recover if she changes her mind and takes the drug. This is a clear action item that will benefit (30% of drug-avoiding women) × (30% of unrecovered drug-avoiding women) = 9% of women. The opposite is the case with men. If a man chose not to take the drug and he did not recover, then it is certain that he will not recover if he then takes the drug. So he should not waste his money or endure any potential side effects by consuming the drug. This probability, which is 1 for women and 0 for men, is known as the Probability of Sufficiency (PS).

Finally, knowing the relative sizes of the benefiting vs harmed subpopulations swings open the door for finding the mechanisms responsible for the differences as well as identifying measurable markers that characterize those subpopulations. For example, women above a certain age may be affected differently by the drug, to be detected by how age affects the bounds on the individual response. Such characteristics can potentially be narrowed repeatedly until the drug’s efficacy can be predicted for an individual with certainty or the underlying mechanisms of the drug can be fully understood.

None of this was possible with only the RCT. Yet, remarkably, an observational study, however sloppy and uncontrolled, provides a deeper perspective on a treatment’s effectiveness. It incorporates individuals’ whims and desires that govern behavior under free-choice settings. And, since such whims and desires are often proxies for factors that also affect outcomes and treatments (i.e., confounders), we gain additional insight hidden by RCTs.

One of the least disputed mantra of causal inference is that we cannot access individual causal effects; we can observe an individual response to treatment or to no-treatment but never to both. However, our theoretical results show that we can get bounds on individual causal effects, which sometimes can be quite narrow and allow us to make accurate personalized decisions. We project therefore that these theoretical results are key for next-generation personalized decision making.

Part 3

This part promised to be a discussion of the practical issues raised by @Stephen. However, I am taking a 4 day vacation and will continue upon my return. This should also give us an opportunity to raise new issues, questions and ideas in light of the (hopefully) clearer exposition of the proposed scheme of achieving more individualized decision making capabilities.

Footnotes

1 P(yt|female) was rounded up from 48.9% to 49%. The 0.001 difference between P(yt|female) and P(yt|male) wasn't necessary, but was constructed to allow for clean point estimates below.

2 Consistency is a property imposed at the individual level, often written as
Y = X \cdot Y(1) + (1-X) \cdot Y(0)
for binary X and Y. Rubin (1974) considered consistency to be an assumption in SUTVA, which defines the potential outcome (PO) framework. Pearl (2006) considered consistency to be a theorem of Structural Equation Models.

3 All derivations are available in the references provided

3 Likes

Introduction
I think I have achieved a glimmer of an understanding of this. It would have been nice to see the detailed calculations and maybe @scott can give them when back from his break. I shall now explain how I proceeded. There is no guarantee that this is what Pearl and Mueller did.

My calculations
I make the following assumptions

  1. Patients can be classified as choosers (who would choose the drug if given a choice) and refusers (who would refuse the drug if given a choice).
  2. The RCT and the Observational study have the same proportion of choosers and refusers.
  3. Thare are no study effects. (That is to say that there are no possible differences in patients, nurses, doctors, epochs etc etc that could have any effect on probability of a succesful outcome.)

Next, I suppose that each arm of the RCT for each sex contains a mixture of choosers and refusers in the proportion indicated by the observational study. The proportions in the two hidden strata (chooser or refuser) cannot be deduced from the RCT alone. However, the assumptions, together with the observed success proportions in the observational study will enable to me solve for the stratum specific success rates. If I do that, I seem to get the result that male refusers will certainly die if they take the drug but would have 70% chance of surviving if they didn’t. One could argue that this means that 70% of refusers will be killed if they take the drug and, since they make up 30% of the population the average male taking the drug has a 21% chance of being killed. On the other hand I seem to get the result that male choosers will certainly die if they don’t take the drug but have a 70% chance of surviving if they do. Since they make up 70% of the population then one can say that a random male has a 49% chance of being saved by the drug. These are the same figures as @scott posted but, of course, it is possible that they were arrived at using a different argument that does not require the strong assumptions 1 to 3. For women I get very similar but not quite the same figures as @scott

Discussion
I now criticise the method (as I imagine it to be) starting with the assumptions. About 1 I have nothing to say. 2. is very strong and, in my opinion unreasonable. It is more than plausible that refusers are people who are less likely to enter clinical trials. (Ask yourself whether anti-vaxxers would be likely to enter a vaccine RCT.) 3 is quite unreasonable. In designing RCTs it is explicitly assumed to be false (that is why concurrent control is used) and there are many real examples that show it is false, e.g. the TARGET study[1]. Instead. one generally tries to model on scales that are assumed additive and use these to transfer results to practice.[2.3]
However, it is possible that some sort of progress could be made by trying to estimate variation from study to study. This is the approach that is used in trying to substitute historical data for concurrent controls. See for example this Bayesian paper [4]. It does require, however, that the variation between RCTs can be used to judge the variation between RCTs and any observational studies,

The biggest objections, however, seem to me to be practical. Here are a few

  1. The method relies on observational studies coming along and providing us with this sort of information.
  2. We currently have personalised enthusiasts trying to persuade us that all the black arts of the 'omics are necessary to personalise medicine. Now it seems that patients just know anyway. This seems very unlikely.
  3. Paradoxically, if 2 is true we may not need to study this. We just need to register drugs that are effective on average. Patients will then know whether they are useful or not for them. (It is possible that a few drugs that are harmful on average but beneficial to some may be missed but for all drugs that have an average positive effect this would be a workable strategy.)
  4. There is the problem of infinite regress. We can always imagine that if we could resolve marginal probabilities further by conditioning appropriately we would do better. (But since we have to estimate there is a bias variance trade-off.) Decision analysis tells us that such information will at worst leave us no better off but may at best improve our chances. However, what we can’t see we can’t see and there are 100s of ways we could subdivide patients. We have no choice but to play the averages (having conditioned reasonably). Fear of counterfactuals does not change that.

In summary.
It is an interesting idea, It would be a challenge to see if it can be made to be useful. I doubt, however, that in practice it is going to help much in personalisng medicine. For that I would have thought stratifying on putative effect modifiers or using n-of-1 studies for those indications where they can be used, would be more useful. That’s not a reason for not pursuing it. It is a reason for being cautious in the claims that are made,

However, it is quite possible that I have got it all wrong. The datamethods community, and in particular Pearl and Mueller can correct me.

References

  1. Senn S. Lessons from TGN1412 and TARGET: implications for observational studies and meta-analysis. Research. Pharm Stat. Apr 2 2008;7:294-301.
  2. Senn SJ. Added Values: Controversies concerning randomization and additivity in clinical trials. Research paper. Statistics in Medicine. Dec 6 2004;23(24):3729-3753.
  3. Lubsen J, Tijssen JG. Large trials with simple protocols: indications and contraindications. Controlled clinical trials. 1989;10(4):151-160.
  4. Schmidli H, Gsteiger S, Roychoudhury S, O’Hagan A, Spiegelhalter D, Neuenschwander B. Robust meta‐analytic‐predictive priors in clinical trials with historical control information. Biometrics. 2014;70(4):1023-1032.
6 Likes

Thank you @Stephen for the response. Your calculations, including your assumptions, are all correct.

Your first three biggest objections seem to be based on the idea that we need observational data where individuals make the best possible choices (if the drug benefits them they always choose the drug and if the drug harms them they always avoid the drug). Is this correct?

Perfect-deciders are not necessary in our analysis, only that there is a difference in the experimental and free-choice regimes. If there was no difference, we would not need the RCT.

2 Likes

Thanks. Your explanation has greatly helped me and I am very pleased to have had the opportunity to learn something new.
The principle of concurrent control has many justifications but one is that if a good scale is chosen, the estimated treatment effect (difference between treated and control group) may be similar from application to application even if the main effect for trial is not. A striking example of how the main effect can vary is given by the TARGET study I previously cited. The additivity assumption has long been used by statisticians to transport experimental results to populations, For example 1) decision analysis requires using the probability scale, for example risk differences (RD) 2) the probability scale tends not to be additive 3) the log-odds ratio scale (although far from perfect) is often more closely additive so 4) analyse on the LOR scale but predict on the RD scale using measures of background risk. See Clinical Trials are not Enough
Thus, trialists would not assume that the observed outcome rate for choosers (for example) would be constant from trial to trial, since a myriad of factors would vary. The vaccine trials have given a striking example of this. The placebo rates have varied dramatically from study to study but since each has used concurrent control this does not matter so much provided the vaccine efficacy (and not the RD scale is used). See Scale Fail.
So, if I understand your method correctly, you are assuming that what statisticians would call the study effect is constant. This is a very strong assumption that often fails.

3 Likes

Sorry, I did not answer your question. No I did not meant to imply that. I can see that it would be sufficient for their decisions to have some predictive value. What would be interesting to know, however, is if there is anything actinable that will arise out of the analysis (assuming other objections, for example, such as variation of other conditions that affect outcome from study to study, could be put aside). Unless we can find some other indicator, don’t we just end up having to say the following to the men?

“On average patients will be better off taking this drug. However if you are the sort of person who won’t take it don’t take it, but if you are the sort of person who will, do.”

I suppose that we could say to the women “even if you are the sort of person who won’t take this drug you should”. Maybe that’s useful. Of course it might be that the drug is beneficial to all women except the very young but that this characteristic is not related to willingness to medicate. Thus, at some level, I assume that we have to accept that we must play the averages.

2 Likes

Thank you @scott for further clarification and confirming @stephen ’s and my understanding of the problem. I have already set out my explanation for your clinical scenario in post 5 and Figure 1 contained in it. I shall try to give an example that relates your scenario to a real disease to make it clearer how a practising physician might see this problem, explain it and share the decision with a patient. So, imagine these patients had congestive cardiac failure (consisting of build up of fluid mainly in the lungs causing breathlessness, abdominal and leg swelling). Say that about X% of the patients in the trial died within Y years if being given a placebo. However, with medication X+28% survived. You then indicated by your examples that this risk difference of 28% applied at all survival rates indicating homogeneity of the risk difference (RD) effect measure on the additive scale in this idealised scenario.

By alluding to the fact that patients were aware of adverse effects from the treatment that might influence their choice of taking or not taking the treatment, we might imagine that the patients were advised that to be safe, the treatment required constant monitoring with frequent blood tests and regular clinic visits to guard against adverse drug effects that were potentially fatal. Imagine that this monitoring tends to constantly remind patients that they are no longer healthy and independent, undermining their confidence and self image, often leading to depression. The patients might also be advised that the risk of death increased as the severity of the breathlessness, abdominal and swelling increased.

One group of men (Patients A in Figure 1 in above post 5) and another of women (Patients B in Figure 1) appeared to have felt reasonably well and had no wish to take medication and its associated problems. The survival rate in these patients was 70% at Y years (with treatment it should be about 70+28 = 98%). However, another group of men appear to have had worse symptoms and were prepared to accept the treatment immediately. Their survival rate was also 70% at Y years (but would have been 70-28 = 42% if they had not accepted the treatment). These were Patients C in Figure 1. However a group of women felt quite ill and feared that they would not survive much longer unless they accepted it. On treatment, their survival would only be 27% at Y years (suggesting that without treatment, the survival would be 27-28 = -1% - perhaps a RD of ≤0.27 would have been better in your scenario). These were Patients D in Figure 1.

In these scenarios the above survival rates only become known during your observational study and would be available to advise future patients in a more accurate way with percentage survival rates, ideally as a pair of curves displaying the probability of survival with and without treatment for different degrees of severity as shown in Figure 1. The severity could be measured using scores based on a symptoms and examination questionnaire, heart size on a chest X ray etc. However data of this kind can also be collected during a RCT [1], which would allow the best effect measure to be chosen to model curves of the kind shown in Figure 1. However an observational study would allow the range of the curves to be extended to include less severe and more severe patients than those included in a RCT.

The RCT and observational study are examples of ‘between patient’ probabilistic evidence, usually conveyed to the patients by a doctor in person or perhaps via reading material (e.g. the advice leaflet inside the packet containing medication). The patient’s personal test result or severity score would connect this ‘between-patient’ information and personalise it for the patient. However, each patient would also have built up personal experience to allow them to estimate the probabilities of their own response to particular situations. For example, some patients might know from frequent experience that they usually felt very unhappy when visiting medical establishments from which they would deduce that there was a high probability of this happening for visits to monitor the effects of this drug too. However, others may have found it a pleasurable experience when they would socialise in waiting rooms and enjoy meeting the staff. ‘n of 1’ multiple cross over trials is another form of ‘within-patient experience. This ‘between-patient’ and ‘within-patient’ evidence would be combined during a consultation to become a process of shared decision making. This is what I understand to be personalised medicine.

I understand precision medicine to be the ability to predict various outcomes (e.g. death or survival) with or without intervention with very high or very low probabilities approaching zero or one. It is possible to do this from time to time (e.g. when treating some endocrine problems e.g. predicting a response to thyroxin from a high level of thyroid stimulating hormone when treating an under-active thyroid). I think that precision medicine depends on identifying powerful predictors from a variety of sources (including the genome). The best predictors are often numerical that assess the degree of disease severity. For example, if the gradients of the parallel curves in Figure 1 had been steeper then this would have provided more precise higher and lower probabilities. If the odds ratio had been the most appropriate measure, the curves would both be sigmoid in shape. In this case, the steepness of the curves and the proportion of results providing very high or very low probabilities would be greater if the likelihood distributions of the test results in those with and without the outcome were further apart [2].

In conclusion I agree with you and Judea Pearl that such observational studies could contribute further information for patient care over and above that provided by a RCT.

References

  1. Llewelyn D E H, Garcia-Puig. How different urinary albumin excretion rates can predict progression to nephropathy and the effect of treatment in hypertensive diabetics. JRAAS 2004; 5: 141–5. How different urinary albumin excretion rates can predict progression to nephropathy and the effect of treatment in hypertensive diabetics - PubMed
  2. Llewelyn H. The scope and conventions of evidence-based medicine need to be widened to deal with “too much medicine”. J Eval Clin Pract 2018, 24, 5, 1026-1032. https://onlinelibrary.wiley.com/doi/10.1111/jep.12981
1 Like

My apologies, Huw. This reminds me that I need to go back and read your original post again. will report back when I have done so.

I may have mixed this up so will be happy to be corrected. In summary, what the authors are saying is that if we take the same 4000 persons as in the RCT into a parallel universe and move them around so that we select who gets treatment and who does not based on some selection scheme and also give treatment to 800 more individuals (we don’t know if this means that some previously untreated get treated or some previously treated get untreated) then we can get a result that differs from the RCT. However this different result, without need to know the selection criteria, gives us additional information about the treatment. Isn’t knowing the exact selection process that led to the choices on treatment a prerequisite for inference of something useful from the observational study?

1 Like

I now realise that @HuwLlewelyn provides a brilliant alternative explanation that provides the difference in points of view in a nutshell. (Sorry, Huw, for not having picked this up earlier, and thanks for helpful correpondence.)
Trialists do not assume that control group rates are constant from study to study, (hence their insistance on concurrent control), not even if the studies are randomised clinical trials with similar inclusion criteria. First, the criteria cannot guarantee that the patients are similar; they can only limit the extent to which they differ. For example, if patients are required to be aged 18 to 70, no patient can be aged 73 but we might find that in one study the oldest is 63 and in another is 69. Many such example could be given. Second, even if the patients are identical, they will not be in the same centres. Centre effects are not assumed to be zero and this is one reason why cluster randomised trials are analysed differently from centre to centre.
Huw’s solution uses an additivity assumption that the treatment benefit (drug-control) is the same between choosers and refusers. If this is so, then he can solve for the unknown response rates using the observational study. Male refusers will have a 70% chance of response if they take the control treatment but if persuaded to take the drug they would have a 98% response rate. This is his solution

On the other hand Judea Pearl and @scott assume that in the absence of treatment response rates will be the same in the observational study and the clinical trial. They then get this solution for males

Note that Huw’s solution does not give the same response rates in the RCT as in the observational study, if we consider that the same mixture of choosers and refusers are present but there is no need for these to be the same and there is no need for study effects to be the same.

I do not think that it is possible to say which of these solutions would necessarily be true (and intermediate solutions are also possible). I personally find the Llewelyn solution much more reasonable, although as @HuwLlewelyn points out, another scale might be a better chance of being additive.

However, maybe I have misunderstood one or other of these approaches and in that case, correction and clarification would be welcome.

2 Likes

@Stephen, when we talk about actionable items in the context of a personal decision maker, you have to forget about the standard notion that only the number of recoveries and number of deaths count. What counts is more than body counts.

First, the tradeoff between killing a person who would otherwise live versus not saving them has a different kind of economical cost to society. A treatment causing harm may involve lawsuits or loss of reputation for hospitals, doctors, society, etc (Li and Pearl, 2019). Second, the decision of the individual also counts. How does the person feel to take a risk of harm from a drug? This is normally not brought into consideration.

@Stephen, you mentioned, “Maybe that’s useful” in regards to giving the drug in our example to women who wouldn’t choose the drug. This is a clear action item that would save a non-trivial proportion of women, with certainty, who would otherwise not recover if all we have to go on is the RCT.

Five significant consequences of going beyond the RCT with observational data are:

  • The drug is not as safe as the RCT implies
  • Women are clear of dangers while men face a 21% chance of being harmed by the drug
  • Policy makers have knowledge of overall societal benefit, if administered to women only, 28% would survive who would otherwise die
  • Clear action items are informing drug-avoiding women that they will recover, with certainty, if they take the drug, and informing all men that they made the right choice (don’t change your mind)
  • Further research is warranted to find mechanisms responsible for the differences between drug-choosers and drug-avoiders

@HuwLlewelyn, risk difference (RD) has two interpretations, causal and statistical/associational. Of course, each interpretation yields different results. In our example, the causal RD among men and among women is CACE(male) and CACE(female), respectively. Is this the RD you have in mind? Neither interpretation of RD violates any of our claims.

Regarding a couple of your assumptions, our analysis did not assume an additive X+28% survived versus X% died for all X. There was a specific X, we just didn’t mention it in the original blog article. It can be deduced, however, from the observational data and from the data I posted in the table above. As such, your counterfactual probabilities differ significantly from ours.

Individuals observed didn’t necessarily know about any adverse effects. Some people might assume taking the drug cannot hurt as the RCT doesn’t make this clear.

You make good points about the possible need for constant monitoring and its effects as well as the between-patient and within-patient issues. However, as I mentioned, we are assuming an ideal RCT and observational study in order to better conceptualize how an observational study can provide insight for better decision making.

@Stephen, the solution you wrote for @HuwLlewelyn assumes the causal effect of treatment on recovery is 0.784 and the causal effect of no treatment on recovery is 0.504. Or
P(y_x|\text{male}) = 0.784, P(y_{x'}|\text{male}) = 0.504
where y is recovery, x is taking the drug, and x’ is not taking the drug in the RCT. This is incompatible with the results in our example and doesn’t yield a point estimate of PNS or P(harm).

Thank you @smueller. I assumed that the 0.28 from the RCTs was a CACE effect and that the outcomes in the observation study were also based on this. Essentially I assumed that the RD from the RCTs had been applied to the observational study, the subjects and methods being exchangeable with those of the RCTs.

It is my usual practice to construct a realistic scenario to illustrate my mathematical models and vice versa as a ‘reality check’. The only scenario that I could devise based on the ‘facts’ provided in your blog was the one I described. It would help me if you could describe a medical scenario to illustrate how your counterfactuals differed from mine, the value of X and how the increased survival rate of 28% applies.

The only adverse effects that I assumed that the patient was aware of were those of personal experience (eg attitude to the medical system) and information available by law in any drug information leaflet included in medical packaging. I also assumed that illness severity is a major influence on decisions to accept or reject intervention. What different factors did you think influenced the decision of the observational study subjects?

I totally support your idea of combining information from RCTs and observational studies in order to better conceptualize how this can provide insight for better decision making. My long term research interest has also been how to use diagnostic and other tests to improve decisions to accept or reject treatments in order to optimise treatment effectiveness and minimise harm from inappropriate treatment.

As I have mentioned already, I would be very grateful if you could help me to understand your approach better by describing a medical scenario to illustrate how your counterfactuals etc differed from mine.

1 Like