Good morning, I wanted to ask your opinion as expert statisticians who have analyzed clinical trials. I have read four randomized trials that have compared immunotherapy versus chemotherapy for advanced tumors. None of the four trials achieved their primary objective of showing a significant increase in survival. All four analyzed the data using the Cox model, despite a flagrant violation of the assumption of proportional hazards (e.g., crossing curves). No other methods for non-proportional hazards are considered at any time, although the Kaplan-Meier curves suggest a significant increase in milestone survival at 24 months (also unanalyzed). The authors conclude in the four trials that immunotherapy does not increase survival, based on a Cox model calculated with inappropriate assumptions. Had the milestone survival or Renyi tests were used, the trials would be considered positive. The curious thing is that this behavior of immunotherapy is already known, it was expected, and in my opinion that could have been better planned, because the same thing happens in most immunotherapy trials. I wanted to ask how this is possible. In theory these laboratories could hire the best mathematicians in the world, so I don’t understand how it is possible that the statistical analyses of such expensive trials, published in Lancet or NEJM, are so poor. I think it must be that clinical-statistical interaction does not work, perhaps because the clinician wants to impose traditional points of view on the mathematician, or for other reasons. I would like to ask your opinion.
As someone who has examined the clinical decision making literature from a number of angles (clinicians, statisticians/mathematicians, as well as philosophers of science) I find the papers written by clinicians frustrating much more frequently than I expected.
Clinicians have gaps in their understanding of statistics and reasoning that they do not realize. I know I had them for a very long while, until I had to understand work written in other quantitative fields.
I gather that they can use the terminology of statistics in a way that these misconceptions are not obvious when they interact with statisticians. But the intuition that statisticians have and the ones clinicians have are not the same.
Example: the most widely cited quote for “evidence based medicine” from Sackett et. al. (1996) (link)
Blockquote
The conscientious, explicit and judicious use of current best evidence in making decisions about the care of individual patients.
About a year later, Richard Royall wrote the following in his book Statistical Evidence: A Likelihood Paradigm
Blockquote
“Standard statistical methods regularly lead to the misinterpretation of results of scientific studies. The errors are usually quantitative, as when the statistical evidence is judged to be stronger or weaker than it really is. But sometimes they are qualitative – sometimes evidence is judged to support one hypothesis over another when the opposite is true. These misinterpretations are not a consequence of scientists misusing statistics. They reflect instead a critical defect in current theories of statistics.”
So we have clinicians assuming they understand what “evidence” means in a scientific context, when statisticians of Royall’s capability are much more circumspect. It is also why the problems with p values have persisted for decades.
There are even more egregious examples of medicine not knowing what mathematicians have learned:
Some letters pointed out that this paper rediscovered the trapezoid rule from calculus. (link)
I wish I knew the solution. But the thread here on common statistical errors is a good start.
I very much liked this answer, in particular the example of the trapezoid. However, I’m not so sure that clinicians’ lack of understanding of mathematical or probability issues is the only explanation. I was referring to four clinical trials that are the vanguard of Oncology at this time: 2 Keynotes, 1 Checkmate and 1 IMvigor. There are millions of dollars at stake. There are supposed to be teams of statisticians who should have reviewed the design of these studies. In fact the Keynote I read includes a rather sophisticated hierarchical design. However, the fundamental problem with immunotherapy is that survival curves tend to cross. No trial took this into account. The paradox is that immunotherapy involves important technological and methodological advances. But for some reason the statistical analysis seems to have lagged behind, even though statisticians are aware of these problems and have been proposing solutions for thirty years.
I don’t have a lot of experience in trial design, but I wonder how these meetings of study coordinators end up devising statistical designs that may not work based on experience with this type of data. Any idea about these failed social dynamics between clinicans and ststistics?
WIthout viewing the results of the four trials there is one general problem to avoid: when there is no treatment effect, survival curves will intertwine making it appear that proportional hazards has been violated when it’s not.
The problem with oversimpified time-to-event analysis can be viewed in several ways. Here’s one. Statisticians want to have their cake and eat it too, in the sense of wanting to use a robust semi-parametric model (Cox) that reduces treatment effect to a single parameter. They don’t want to dilute power into two parameters requiring a two degree of freedom test. Then they worry about proportional hazards and do supplemental analysis such as mean restricted lifetime. All of this is avoiding a central issue: if we don’t know that a non-negligible treatment effect operates in proportional hazards ahead of time, it is often not correct to force the effect into a single parameter but instead to be fully honest in admitting what we don’t know and using at least two parameters. This underappreciated paper has the right spirit. Devote a parameter to the average log hazard ratio and another parameter to the interaction between treatment and log time. Test for a treatment effect with 2 d.f. with a perfect multiplicity adjustment.
The above referenced paper shows how to do this with an instantly calculated 2 d.f. Rao efficient score test. You can also do the iterations and fit the parameters, to estimate the treatment effect as a function of time.
Bayesians do one better by devoting k d.f. to treatment where 1 < k < 2, by putting a skeptical prior on the time x treatment interaction effect to favor proportional hazards but allow departures from it as the sample size permits.
In conclusion, oversimplification is one culprit of misleading and overly confident analysis.
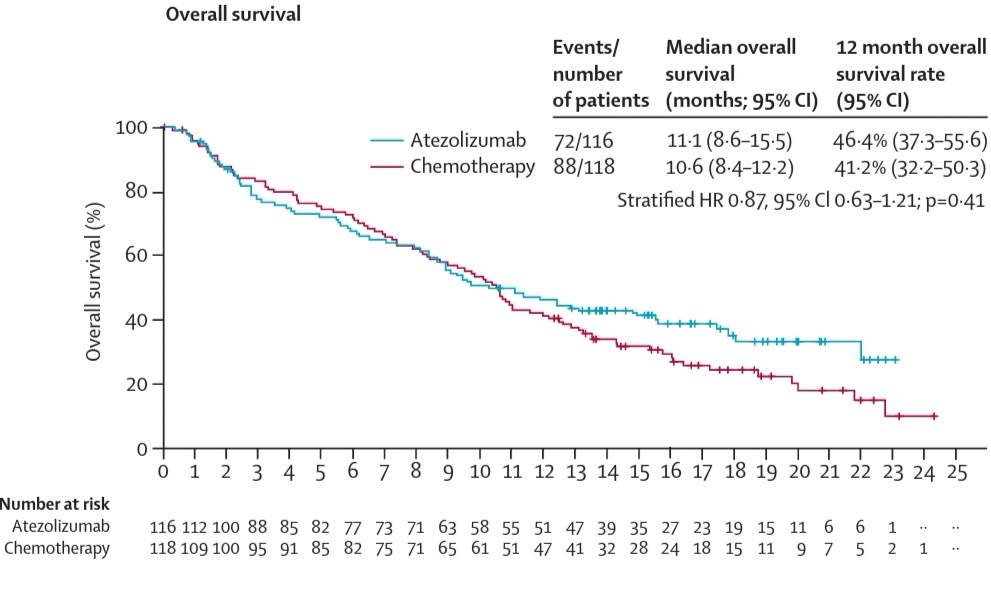
Thank you, Frank, for your comments. This is one of the examples, the IMvigor211. The study is declared negative but in reality there seems to be a relevant survival benefit. I would like to imagine and understand how these issues are initially settled by the coordinators. Have you lived these type of discussions in your career?
In this study it would have been worthwhile to apply two or three degrees of freedom. The difference in milestone survival rate at the tail seems significant with a p of three zeros.
i would say, in general, it does seem untenable that analysis plans stipulate the primary analysis will be the most conventional ‘vanilla’ analysis possible (ie Cox), with more thorough and sophisticated tools used in secondary or sensivity analyses. How would we justify this to a lay person? we say more sophisticated methods imply more assumptions? but simplicity implies assumptions too? “the lack of balance after randomization may complicate the interpretation of the HR, even if the proportional hazards assumption is satisfied at the population level” Limitations of hazard ratios in clinical trials
I see no evidence favoring either atezolizumab or chemotherapy in that survival analysis. “Milestone” or “landmark” analyses are very problematic (as discussed here) and the numbers at risk are way too small to make any valid inferences after the 12 month cutoff (when those K-M curves start to separate). Also, keep in mind that they used a stratified Cox model which can address the problem of proportionality if the stratification is done by the covariate(s) that do not satisfy the PH assumption (although one can validly claim that an appropriately covariate-adjusted unstratified Cox model would achieve the same). In addition, there is a cost to testing the PH assumption and then switching to, e.g., a RMST model in that it generates too narrow CI (see here). If anything, I’d say that the results of the presented stratified Cox model are uninformative with the data being compatible with a HR of 0.63 and 1.21 (the data are compatible with clinically meaningful effect size differences at opposite directions).
The real question I ask myself at the end of the day is not about the hazard, but how many of my patients are going to be alive in the medium to long term. Could you please develop the problem with these estimates?
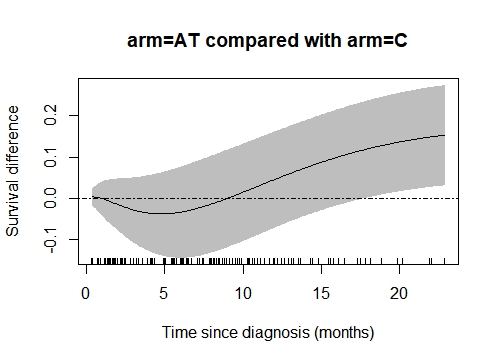
To try to clarify the question I digitized the curves (taking into account the censored data), and applied the Royston-Parmar spline model with two degrees of freedom for the baseline hazard and two for the covariable. The result (see figure) shows a difference in survival at the end, which coincides exactly with the estimates by non-parametric methods, FH, Renyi tests, and with the general appearance of the Kaplan-Meier estimates.
Is there any reason I don’t know why this is a mirage?
The difference seems to very real!!
im_sdif_jpg|499x362
Curves focusing on differences (and their confidence intervals), like the one you generated, are indeed more appropriate than K-M curves for evaluating RCTs, since they focus on the contrast between the two groups. However, estimates become increasingly unreliable as time gets further away from randomization, and this does not appear to be captured in the confidence bands of the figure you produced.
I have done it again with non-parametric methods (as described by Klein) and the result in the tail is still significant. What else could I do?
Very interesting, what fixed time point did you use to make your comparisons and what p-value did you get? I would not make too much of this re-analysis (hypothesis-generating at best) partly because I generally find comparisons of marginal survival functions to be of less clinical relevance than covariate-adjusted ones, and because such comparisons can be imprecise if the milestone timepoint is too late. The latter is the reason why it was proposed here to refrain from presenting the K-M plots after timepoints where less than 10-20% of patients are still in follow-up.
Thank you very much for the comments, in the time point 22 months for example, I get a non-parametric p-value, for the difference in milestone survival of 0.0141. It seems that there are 10% more survivors, and in addition the immunotherapy is tolerated much better. On the other hand, the Fleming-Harrington test, p=0.5, q=2, has a p-value of 0.02. For all this I have the feeling that this type of trials are very often declared negative, but if analyzed otherwise, possibly the story could have been different. The problem is that these examples are relatively frequent.
but the risk set is different at 22 months post randomisation, as per the link i gave above
The article is very interesting, although what it argues is the difficulty of interpreting hazard ratios over time. It suggests that the difference of events before a fixed point can be an alternative. I do not know if there is any additional way to revisit the IMvigor211… as shown above.
I don’t like formally testing differences at a single time point, usually. Instead show confidence bands for the difference in KM curves - see here for an example. And use your pointing device to hover over points on the KM curves to see numbers at risk.
But the tone of this discussion makes be believe that we have all forgotten to do the most important thing: If you want to detect all possible differences between unadjusted survival curves and to perfectly control multiplicity while doing so, use a Kolmogorov-Smirnov two-sample comparison accounting for right censoring.
Is there an R package available that makes estimates by this method?
I would like to try …
Has anyone proposed a consensus statement on how to approach the design of these studies? Are there binding regulatory agency documents that can guide the methodology?
Don’t think you’ll find detailed guidance. If I had my way I’d always use a Bayesian proportional hazards model with a prior for the amount of non-proportionality.
@albertoca you brought up in this thread some very important points that are currently a hot topic of discussion among immunotherapy clinical trialists in oncology. @f2harrell 's suggestion is excellent and I believe the old R package surv2sample could do a two-sample KS test for censored data.
I think that a lot of the inferences you mentioned would be better served by Bayesian models which can easily produce probabilities like P(treatment A survival at year 2 > treatment B survival at year 2 | data), given the prior and the model. It is a lot of fun working with statisticians to come up with these priors and models, and it is no less subjective than pure frequentist approaches. Here is a nice link with some freely available and accessible Bayesian early phase trial designs, including some that were designed specifically for immunotherapies.
For these reasons, all four ongoing clinical trials that I am the PI for use mainly a Bayesian approach. Having said that, I do think that: 1) industry statisticians are much more thoughtful than we academic physicians often realize; 2) Bayesian models often use a confirmationist (inductive) approach. I do respect the requirement for phase 3 trials to apply refutational logic (falsification of the null hypothesis) via a frequentist approach. For that purpose, the score test from an appropriately covariate adjusted PH model often does an adequate job. However, to avoid the potentially uninformative results from these analyses (when they are too imprecise) I would supplement them with additional prespecified endpoints/questions that would condition on the data. In addition, I favor a Bayesian framework (e.g., with an enthusiastic prior) for interim analyses/decisions, even in otherwise purely frequentist phase 3 trials, to avoid what is described here from happening.
A nice idea could be a plot of time-dependent Bayes factors. Is that possible?