I have no idea what I wrote there. What I meant to say was that failing to reject the null hypothesis by getting an observed P greater than a prespecified alpha is not enough to rule out a difference. For more support of the null hypothesis, one must use equivalence testing. And depending on how they set it up, it could be used to rule out meaningful effects. But this is all more idealistic than anything, given that equivalence testing can often have problems of its own.
Given that interval widths decrease with more available sample information and become more informative about the parameter, an interval that is narrow is far more informative than an interval that is wide.
The width of a confidence interval indicates the precision of our knowledge about the parameter. Narrow confidence intervals correspond to precise knowledge, while wide confidence errors correspond to imprecise knowledge.
There is no necessary connection between the precision of an estimate and the size of a confidence interval.
I would agree that, given an infinite N, the CI converges to a point. But I think I understand the author’s broader point – for any finite sample, a CI is a random interval, and the width is in some sense, a random number. The precision of our estimate is contingent on nothing more than the size of our sample, which is only related to the width of the interval “in the long run.”
You are right. Personally I see a confidence intervals as a descriptive statistic. Most of the time, a 95% CI is simply x̄ ± (1.96 * SE). So it is a summary of the data.
Sometimes your datapoints are close together. Then you have a narrow CI. It happens.
My question here is who counts as sufficiently expert to provide statistical review. Not all statisticians are expert across a wide range of areas of statistics and some non-statisticians are reasonably expert in certain areas. When I review papers some journals have a tick box for “needs statistical review” and I am never quite sure whether my own expertise counts or not. I regard myself as an epidemiologist with reasonably good statistics knowledge (self taught). I generally tick “yes” if it has an appreciable amount of data analysis.
Paul, that’s indeed a challenge. I know physicians with no formal statistical training (meaning, no statistics degree) that I think are generally capable of providing a sound statistical review; also, as you point out, statisticians may struggle to review papers outside their “usual” area (for example, I would want no part of reviewing a paper on GWAS - I’ve never worked on one, or in that area, and don’t feel sufficiently expert to provide a good review). It’s hard to provide a single answer to “who” is capable of providing statistical review based on qualifications alone. But, even if we don’t have a perfect answer, surely we can avoid such blatant errors as this.
The one little disagreement I have with the last two responses is my belief that one who deeply understands statistical principles can detect bullsh** in many areas, including ones in which they may not have received training such as GWAS and machine learning.
Agree heartily with this. Any discipline that insists it can be criticized only ‘from the inside’ as it were, effectively makes a claim to esoteric knowledge. Marxism, e.g., makes such a claim through its doctrine of false consciousness. Here’s Karl Popper’s wonderful story about his discovery of the demarcation problem which proved so fruitful in the development of his philosophy of science:
Andrew, I have been at work to demonstrate the critical mode of argumentation I expect should prove more effective with the paper’s surgical audience. As I indicated on Twitter, my planned mode of attack requires first reproducing their effort. Senior author David C. Chang has provided a screenshot of a Stata calculation for PMID 26747224, showing how they obtained the PHP of 0.08 (rounding up 0.0782, apparently) reported on the first line of their Supplement:
. power twoproportions 0.337 0.369 n1(112) n2(104)
which shows a misreading of the abstract. My own calculation of the abstract’s reported p = 0.626 is as follows:
> prop.test(x=c(35, 38), n=c(104,103), correct=FALSE)

	2-sample test for equality of proportions without continuity correction

 data:  c(35, 38) out of c(104, 103)
 X-squared = 0.23787, df = 1, p-value = 0.6258
 alternative hypothesis: two.sided
 95 percent confidence interval:
  -0.16251107  0.09772391
 sample estimates:
   prop 1    prop 2
 0.3365385 0.3689320
In any case, the Editor (if you are still in communication) might perhaps be persuaded to insist on reproducibility [1] as a bare minimum standard for publication in Journal of Surgical Research. Forcing a correction (with provision of abstracted data and Stata .do files) would represent progress, at least.
Goodman SN, Fanelli D, Ioannidis JPA. What does research reproducibility mean? Science Translational Medicine. 2016;8(341):341ps12-341ps12. doi:10.1126/scitranslmed.aaf5027
David, that’s a very good catch. I am happy to pass this on to the editor, but it may be more effective if you contact him yourself, as you’ve put thought into this from a different perspective than I. Given that different approach, it may be more effective to hear from a different voice, especially since you’re the one who has suggested the alternative approach of proving the concept fallacious by reproducing the original first.
EDIT: I hesitate to put the editor’s email address in view on a public forum, but if you DM me on Twitter or email me (my Pitt email address is easy to find via Google searching my name), I’m happy to share it with you that way.
I have corresponded directly with David about this, but an update for anyone who follows on this thread:
The paper originally included a Supplemental Table with the PMID, power, and effect size of each paper as pictured above. As you see above, David cleverly suggested that perhaps a way to convey to the authors (or at least, the journal editor) the futility of the proposed solution would be fully reproducing their effort, first reviewing the individual articles to see where they had made mistakes (which would impede our effort, since illustrating that the post-hoc power is directly related to the p-value first requires that calculation of each quantity is correct).
Today, when I went back to the article to pick this up and closely examine some of the papers included in their review, I found that the Supplemental Table which included this result has disappeared.
Darren Dahly posted a screenshot from the original on Twitter showing that this was previously in the paper, but that it was removed at some point in the month since the paper was published online:
It appears that, with the growing scrutiny around this article, perhaps the authors or the journal chose to quietly remove the Supplemental Table which allowed people to closely examine the work. I can’t confirm anything, but it certainly looks suspicious.
EDIT: someone from Elsevier responded to confirm that the Supplement was removed in between the first posting of the article online and the ‘final’ version being posted online, and furthermore that the editor-in-chief was unaware that this had been done, but declined comment when asked whether this was done at the authors’ request.
@zad & @Sander’s recent pair of arXiv papers [1,2] — on which, BTW, I’ve offered this PubPeer comment — have revived my interest in extending my earlier efforts to reproduce the Supplement. In a couple of posts at PubPeer this past week, I noted discrepancies between the Supplement and the paper’s Figure 1 and also posted results from a partial reproduction. Interestingly, this reproduction exhibits several discrepancies explainable as simple data entry errors occurring during (what I must suppose was) the authors’ hand-collation of ‘post hoc power’ calculations performed manually at the Stata console.
This paper thus gives every appearance of having reported a fundamentally irreproducible activity. Even if reproducible research (RR)—the statisticians’ sterile technique so to speak—has not yet been adopted within Surgery, certainly the concept of a reproducible sequence of actions is foundational to that field. Consider this extended quotation from [3]:
I recall once in the winter of 1964, 6 very young children with transposition of the great arteries were awaiting operation. Operative correction of this problem had not been well defined. Dr Kirklin had used the technique of Dr Senning from Switzerland, and in 1961, he published his experience with 11 pediatric patients; and although most of these patients survived for many years, operative mortality was still 15%. In 1 week, Dr Kirklin performed this operation on 2 of these 6 waiting infants; unfortunately, both died a few days after the operation. Dr Kirklin became noticeably sad and frustrated and informed his residents that he would not be operating for a few days and instructed us to notify the parents of the other 4 children to go home. He gave no other details. … Four days later, Dr Kirklin returned and told us to contact the 4 families to return to Rochester. All returned and were promptly operated on, recovered well, and left the hospital 1 week later; but we all noticed that he used a different operative technique. He informed us that he had visited his friend, Dr William Mustard, the Chief of Cardiac Surgery at Sick Children Hospital of Toronto, who had introduced a new procedure to correct the transposition of the great arteries and published it with good results in 1964. Thereafter, Dr Kirklin performed many of these procedures in 1 stage and published his excellent results in 1965. Dr Kirklin believed that in surgery there are only 2 causes of failure—lack of knowledge or human error—therefore, when confronted with his own ‘‘failure,’’ he sought a new solution for his ‘‘failure.’’ The previous anecdote was a good example.
So there seems to be ample basis for JSR to press for a Retraction & Replacement, with publication of the abstracted data along with a Stata script. Indeed, this episode might serve as a cautionary note that increases the visibility of RR principles among surgical researchers who may not have encountered them.
The reason I connect all this with [1,2] may be found in the following figure from my repro posting:
To the surgeon’s practical, ‘hands-on’ mentality, this figure should thoroughly debunk the efforts in [4] as essentially a sham [statistical] procedure. All that error-prone typing into (and transcription from) the Stata console could have been accomplished with a scientific calculator: just calculate the surprisal s = -\log_2 p, convert to bytes, and subtract 0.05. The only thing lost by this shortcut is the placebo effect of using the word ‘power’.
Furthermore—now in a fully constructive vein—this argument serves also to introduce the ‘compatibilist’ toolkit of Chow & Greenland, which I have begun to appreciate as an especially promising solution to the sorts of problems that one might suppose legitimately motivated the authors of [4].
Aldrete JS. Dr John W. Kirklin (1917-2004): a unique surgeon. Surgery. 2010;148(5):1038-1039. doi:10.1016/j.surg.2010.07.044
Bababekov YJ, Hung Y-C, Hsu Y-T, et al. Is the Power Threshold of 0.8 Applicable to Surgical Science?—Empowering the Underpowered Study. Journal of Surgical Research. 2019;241:235-239. doi:10.1016/j.jss.2019.03.062
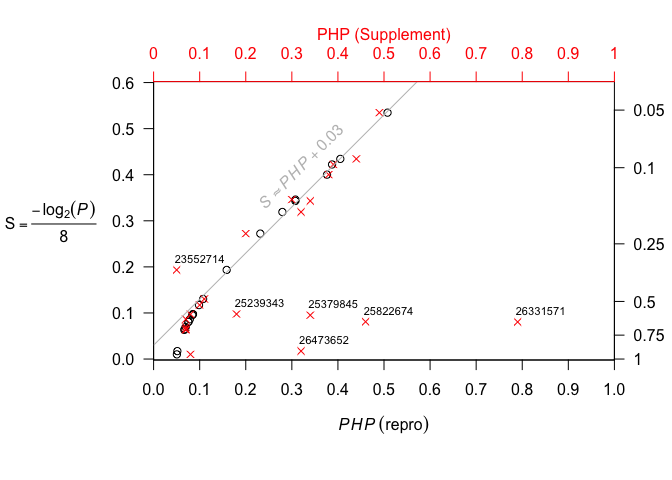
By way of a brief follow-up, I’ve recently posted the following figure as part of a PubPeer comment aiming to (re-)focus attention on the irreproducibility of [4] (cited above).
This figure exhibits discrepancies between the Supplement’s post hoc power figures (red x’s) and the ‘correct’ (don’t @ me …) calculations performed by yours truly.
A solution around calculating ‘observed power’ that may be useful after data collection has ended may be to use an expected effect size from a published study. Neglecting to conduct prospective calculations to provide assurance that adequate power exists in studies was common in one review of published research (Pocock et al., 2004). I have found it to be true in recent research. Oftentimes, a published study exists that authors didn’t think to use when starting their research. If the research team or a reviewer catch this problem after data collection ends, why couldn’t they do the power calculation using the effect size from the previous study? As an extension, it seems that using an effect size from an external study published subsequently would be fine. Challenges of ‘cherry-picking’ an effect estimate for the calculation may result, but if authors think through which effect estimate is the most unbiased,* they could defend their methods. This approach would avoid using the effect size from the trial they are working on in their power calculation. Does anyone have objections to this approach?
*Ioannidis discusses other factors that affect positive predictive value of research findings beyond power such as study design and how well that study was performed (Ioannidis, 2005).
References
IOANNIDIS, J. P. 2005. Why most published research findings are false. PLoS medicine, 2, e124.
POCOCK, S. J., COLLIER, T. J., DANDREO, K. J., DE STAVOLA, B. L., GOLDMAN, M. B., KALISH, L. A., KASTEN, L. E. & MCCORMACK, V. A. 2004. Issues in the reporting of epidemiological studies: a survey of recent practice. BMJ, 329.
Namely: I don’t really care what a particular study’s power was/is to detect the size of effect found in another study. The objective of a power calculation in study planning is to establish that the study is sufficiently larger to have a reasonably high probability of concluding that an effect is present under a set of assumptions; those assumptions should include (IMO) setting your study to detect the smallest effect size that would be important to detect in this study. The fact that a different study found a 30% relative reduction in mortality with a different intervention, or in a different population, or with a different analytic approach, ought to have little bearing on what I think would be a clinically relevant reduction in mortality in this setting (though it’s true that inevitably we will often judge whether a treatment is “really effective” or “just a little bit effective” in part by comparing the effect that it demonstrated against the effect demonstrated by other treatments in the same arena).
If you must do a post-hoc power calculation, do it based on an effect that you judge to be a clinically meaningful difference you’d not want to miss. Of course, a common retort to this is “Well how do we pick that?” and it’s true that there is no one size fits all answer! But, I think that affixing it to “an effect from a different study” simply shirks the responsibility of thinking about what’s an important or meaningful effect and says “We’ll just use the number from a different study.”
Thank you for your response! I agree with many of your ideas and have some further considerations from an economist’s perspective.
I agree that the minimum relevant effect size generally is a better metric than the effect found in another study. For projects that did not consider sample size calculations prospectively, there should not be any impediment to picking this minimum effect value retrospectively, paying attention to prevent calculations done with the objective of making results confirm a biased opinion such as a study having sufficient power.
Also, I agree that using an effect from a similar setting can proxy an effect size of interest, particularly where effectiveness depends on quality of implementation. This case is particularly relevant for complex public health interventions and if the team implementing the intervention is the same or a similar group. From a continuous quality improvement perspective, teams should try to make the intervention at least as effective as they were able to in the first program.
Henry Glick (1) provides an example of sample size and power calculations when different opinions exist methodologically. The formula he presents regards sample size and power calculations for incremental net-benefit (a transformed form of cost-effectiveness analysis), and includes an assumption about the value of a unit of health gained or disability averted. Instead of tying the calculation to a single value, he plots results along a curve (2). Ultimately, readers of a study will need to decide what value is appropriate for their purposes, but presenting a curve makes results more widely useful. Different sets of rationale are available to decision makers for formulating the valuation mentioned above (3, 4). In the same way, power calculations can be done for various values of a minimum effect size.
Some people may argue that any improvement that is not due to chance is important, no matter how small. And other arguments exist that statistical significance may not be important in some cases. In his ‘irrelevance of inference’ paper (5), Claxton argues that decision making based on expected values is sufficient when decision makers face a large number of decisions (Kenneth Arrow’s paper (6)). If decision makers are right more than they are wrong, then the net-benefit to society is positive, ignoring the consequences and payoffs of decisions. However, decision makers (e.g. physicians) may be much more risk averse and costs and consequences of being wrong are important. Therefore, expected value of information analysis considers the latter, which motivates the Bader et al. (7) approach. A minimum level of cost-effectiveness may be even more relevant than effectiveness given the number of health systems where costs are spiraling upwards.
References
Glick HA. Sample size and power for cost-effectiveness analysis (part 1). Pharmacoeconomics. 2011;29(3):189-98.
Shillcutt SD, Walker DG, Goodman CA, Mills AJ. Cost effectiveness in low-and middle-income countries: A review of debates surrounding decision rules. Pharmacoeconomics. 2009;27(11):903-17.
Claxton K, Martin S, Soares M, et al. Methods for the estimation of the National Institute for Health and Care Excellence cost-effectiveness threshold. Health Technol Assess. 2015;19(14):1.
Claxton K. The irrelevance of inference: a decision-making approach to the stochastic evaluation of health care technologies. J Health Econ. 1999;18(3):341-64.
Arrow KJ, Lind RC. Uncertainty and the evaluation of public investment decisions. The American Economic Review. 1978;60(3):364-78.
Bader C, Cossin S, Maillard A, Bénard A. A new approach for sample size calculation in cost-effectiveness studies based on value of information. BMC Med Res Methodol 2018;18(1):113.