You haven’t even made an attempt to explain why you think likelihood ratios even matter, yet you keep repeating this as if it some kind of conclusive, killer argument
Lets take the example I gave above - four groups of individuals are present:
0 no-intervention and not-obese
1 intervention and not-obese
2 no-intervention and obese
3 intervention and obese
If we take group 0 as the reference group (baseline odds 0.25) then the OR’s are
1 = 2.67
2 = 6
3 = 16
if we take group 1 as the reference (baseline odds 0.67) then the ORs are
0 = 0.375
2 = 2.25
3 = 6
In both cases the OR is the likelihood ratio connecting say baseline odds (however we define this) to the posterior odds (and these can be converted to probabilities thereafter). This of course is a different likelihood ratio from that seen in diagnostic testing but is nevertheless a likelihood ratio with the mathematical relationship being:
OR = pLR / nLR
The reason I keep bringing this up is that to deny this property of the OR means we deny the whole system used in diagnostic testing because nLR and pLR are also odds ratios (of a different type) and if we embrace them there we must do so here (unless you believe that nLR and pLR are also problematic).
Another interesting observation is that the marginal treatment effect is OR = 2.25 in this example. The OR is also 2.25 when comparing group 1 to group 2 and this tells us why the marginal OR was different - the groups created by ignoring obesity were again groups of different individuals with different odds of the outcome. One final comment is that in this example, there are the same number of obese persons within both intervention arms, but that does not define whether the intervention group’s odds of the outcome should differ from that of a group made up of all obese or of all non-obese.
Is your argument really that if a mathematical object is appropriate for one context, then it must also be the most appropriate mathematical object to use in other contexts?
Can you please explain the connection between diagnostic tests and randomized trials, and demonstrate why they must always rely on the same methodological machinery?
Log likelihood is the gold standard and is the most sensitive measure. You can relate it to other measures you might find more subject-matter-relevant but I highly recommend log-likelihood. You can compute the proportion of log-likelihood explained by purely additive effects, using as many link functions as you want. This will quantify the degree of additivity, e.g., constancy of treatment effect across levels of all other variables.
They are the same odds ratios used in either context and thus have the same property - we just have to be careful about the context in terms of interpretation.
Blockquote
The switch risk ratio model is specified prior to data collection. The SRR just resolves to a number that is in the range [-1,1] where negative numbers means the effect is protective and positive numbers means it is harmful. It doesn’t use any data to determine if the effect is positive or negative, any more than the odds ratio uses data to determine if OR is below or above 1.
In your arXiv paper, it is defined as (using table 2):
-
1- \frac{1-p1}{1-p0} if p1 > p0 [In other words: 1 - survival ratio]
-
0 if p1 = p0
-
-1 + \frac{p1}{p0} if p1 < p0 [In other words: -1 + risk ratio]
So essentially your procedure is still estimating a binomial proportion, but places it on an elongated scale. It essentially widens the range of values and mutes the problem of asymmetry, but I fear it will still have problems with floor and ceiling effects, at least in small samples.
I’ll concede that my intuition about the SRR using the data to select an estimate is incorrect. The procedure just maps the probability scale from the range [0,1] into the range [-1,1]. I’m still not sure if it is an “admissible” estimator, though. It seems like combining the risk scales as you do increases the variance relative to either scale individually.
FWIW: I appreciate your thought provoking proposal. I’m still working through the paper. Lots of reading to do.
I think it is important to be clear that our intention in the “Shall we count the living or the dead?” paper was to discuss the switch relative risk not as an estimator but rather as an estimand. We aren’t really considering estimation at all in this paper, and I don’t consider estimation to be that relevant to the points we are making.
A next step would be to reason about whether the estimators for the switch relative risk are better or worse than the estimators for the odds ratio. The likelihood function for the switch relative risk model is discontinuous at 0, this causes some problems for maximum likelihood estimation, as noted by van der Laan et al, JRSSB 2007. However, my more mathematically oriented collaborators (Daniel and Rhian) have found a solution to this, which will be discussed in our upcoming preprint. Other than the discontinuity, maximum likelihood estimation works in exactly the same way as for the odds ratio (If I understand correctly, the math is messier, but the simplicity/elegance the math used for likelihood function optimization is really quite peripheral to model choice, we have computers that do this for us).
This parallel to diagnostic testing was demonstrated elegantly in 1983 by James R Murphy who also demonstrated the fact that the same magnitude of the RR may connote a different “predictive strength of the calculated relative risk”. Perhaps the time has come to make a distinction between effect measures and association measures the distinction being the former accurately depicts outcome discrimination because it fits with diagnostic test principles and the latter does not.
Daniel Farewell, Rhian Daniel and I will give a talk at the Berlin Epidemiology Methods Colloquium on Feb 2nd that is relevant to this discussion. Mats Stensrud is also a coauthor on the manuscript. Please register at Webinar Registration - Zoom
At this talk, we propose a unifying framework for statistical models, which we call regression by composition (RBC). RBC includes as special cases all generalized linear and generalized additive models, as well as many other models. Among the advantages of RBC is that it allows link functions based on the switch relative risk. The RBC framework also facilitates general insight about central issues in statistical modelling, including collapsibility and the nature of homogeneity assumptions.
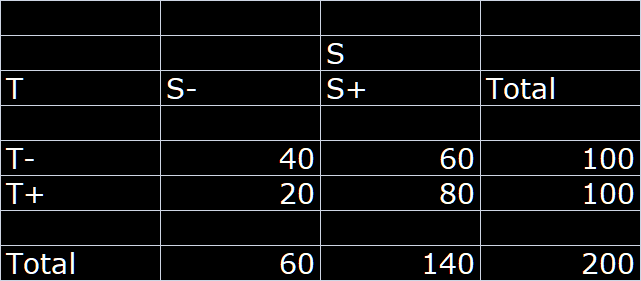
The best way to bring definiteness to this discussion is to demonstrate exactly what the RR stands for as that will make everything explicit. We have spent too much time discussing abstract philosophical ideas under which the problem has remained buried. Lets start by taking this example of a RCT where T+ and T- are treated and untreated while S+ and S- are survived and did not survive respectively:

Lets assume this RCT has a balanced treatment allocation and we can compute two complementary RRs as follows:
RR_S+ = 1.33 and
RR_S- = 0.5
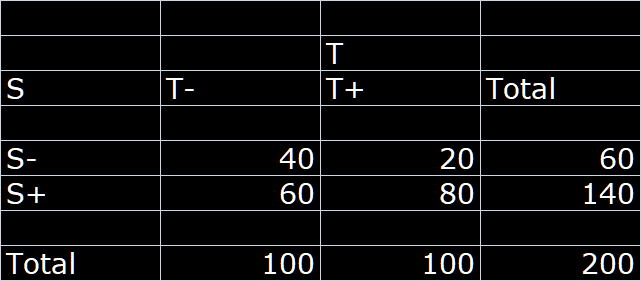
Let us now turn the table sideways: and look at this as a diagnostic problem i.e. if we consider the survival status at follow-up as the index test then we use this to determine the posterior probability that a person with S+ status was treated or a person with S- status was treated:

We can now compute the two diagnostic likelihood ratios as follows:
LR(S+) = 1.33 and
LR(S-) = 0.5
We now have the exact interpretation of the classic RR as the likelihood ratio if the outcome was designated a test of the treatment status (gold standard).
The RR is thus nothing more than the likelihood ratio connecting the prior and posterior odds and if the prior probability (unconditional) of the treatment is 50% (balanced allocation) then the RRs are just posterior odds:
Pr(T+) = 0.5 and Od(T+) = 1
Od(T+ | S+) = 1 x 1.33
Od(T+ | S-) = 1 x 0.5
Thus
Pr(T+ | S+) = 1.33 / 2.33 = 0.57
Pr(T+ | S-) = 0.5 / 1.5 = 0.33
Thus we can conclude that the RR is a ratio of odds that has been misinterpreted as a ratio of risks
Implications:
- The RR is only a constant when understood as a ratio of two odds (conditional/unconditional) and this explains why it changes with baseline risk when misinterpreted as a ratio of two risks (Ref paper in first post above that started this thread). For this reason both RR and switch RR will be dependent on baseline risk, when misinterpreted as a ratio of risks.
- The complementary RRs are simply two LRs, one for the positive test and the other for the negative test - this explains why the RR is asymmetric. It also explains why the RR divided by the so called switch RR equals the OR
- The RR cannot be an effect measure because the ratio of a conditional to unconditional odds does not allow for a monotonic relationship with outcome discrimination. We need both the RR and the complementary RR to be combined in order to be able to say anything about outcome discrimination. This has been well known in diagnostic test research groups over the decades and thus the use of the AUC and the DOR for test discrimination
First of all, I want to strongly emphasize that my philosophical claims are not at all abstract, it is a very concrete argument. Everything we do here is philosophy, and your arguments are not less philosophical than mine, they are just much more confused.
The structure of my argument is very simple, and can be summarized as follows:
(1) We first think about what possible ways nature can work.
(2) We then think about each of those possibilities, in terms of their consequences for whether any mathematical objects (such as effect measures) may be stable between settings. For some states of nature, a specific effect measure will be stable, for other states of nature, no effect measure will be stable.
(3) Finally, we ask ourselves if we have substantive knowledge that allows us to distinguish between the possible ways that nature can work. Only if we think the world we live in is closely approximated by one of the simple possibilities in which an effect measure is stable, do we have a valid reason for acting as if an effect measure is stable.
In contrast, the structure of your argument is as follows:
(1) The odds ratio is a likelihood ratio/shares certain properties with test characteristics
(2) Therefore, the odds ratio is stable if the likelihood ratio is stable
I don’t think it needs to be stated that this is not a valid argument, in the absence of an explanation for why the likelihood ratio can be expected to be stable.
The risk ratio can be restated in many different ways. The fact that it can be restated in the way that you suggest, does in absolutely no way preclude the validity of interpreting it as a ratio of risks. Of course it is valid to interpret it as a ratio of risks, that’s how it is defined!
Nature does not care one bit how you “interpret” effect measures. The only thing that matters is whether you have a substantive reason for expecting it to be stable. And you are not even making any attempt to clarify conditions that would lead to stability of the odds ratio.
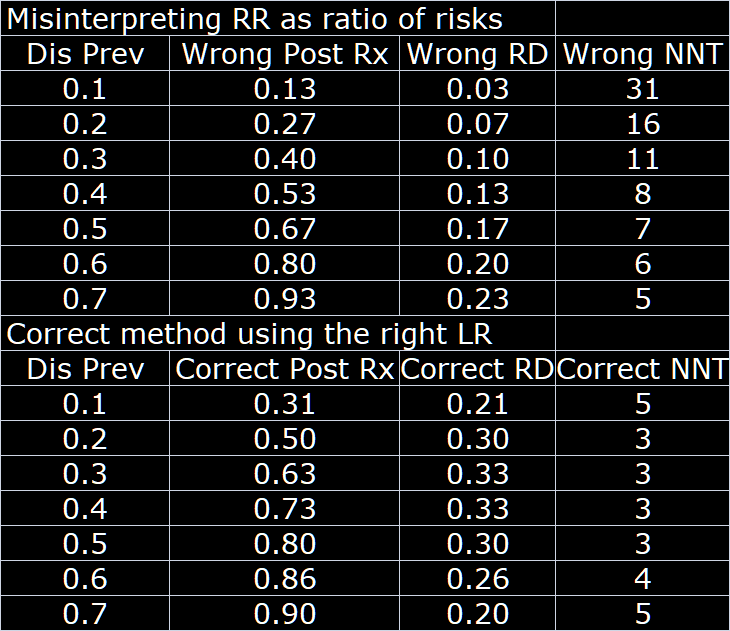
The consequences of the misinterpretation of the RR as a ratio of risks are not trivial. To illustrate from the results in the above hypothetical trial extended to different baseline risks:
What are you even talking about? Of course it is valid to interpret a ratio of risks as a ratio of risks. This is not complicated.
Is this just a table showing the consequences of relying on an assumption of RR stability, when the truth is that the OR is stable? Then sure, in this hypothetical setting, the consequences are not trivial. However, you are assuming the conclusion: You are starting out with an assumption that the likelihood ratio is stable.
This summarizes the whole point of this post which is precisely the point that this ratio is misinterpreted as a ratio of risks by everyone when it is really a ratio of likelihoods. Thus since
L(T+ | S+) = K × Pr(S+ | T+)
L(T- | S+) = K × Pr(S+ | T- )
then the ratio cancels out K (a positive constant) and thus appears to be a ratio of risks and thus the naive interpretation as such. The problem is that the likelihood isn’t actually a probability and because K cancels out there was unfortunately the same numerical value of the probability ratio leading to where we are today. The value of a single numerator or denominator is meaningless in isolation; only in the ratio (comparing likelihoods) should we look for meaning.
The risk ratio is defined as \frac{Pr(Y^{a=1})}{Pr(Y^{a=0})}
Pr(Y^{a=1}) is a risk
Pr(Y^{a=0}) is a risk
\frac{Pr(Y^{a=1})}{Pr(Y^{a=0})} is a ratio of risks
QED
If you think the whole point of the argument is summarized by your claim that the risk ratio cannot be interpreted as a ratio of risks, then your argument is on very shaky grounds
I will take your word for the claim that the risk ratio can be restated as a ratio of likelihoods. This does not in any way change the fact that it is defined as a ratio of risks, and that it is fully valid to interpret it according to its definition.
Sincere question: What does the word “interpret” mean to you? Why is it important how someone interprets a mathematical object? Why do you think there can be a unique correct interpretation? How can it ever be incorrect to interpret something in exactly the way that the object is constructed?
When you have thought through these questions, can we please move on from your red herring ideas about “interpretations” and start discussing what biological mechanisms would lead to stability of an effect measure between patient groups?
Yes this looks like risk ratios to me. The problematic part is that risk ratios were created to capture relative risks of two homogeneous groups of subjects. When a group is not homogeneous (e.g., not everyone in the group has the same age) then risk ratios, like unadjusted (unconditional) odds ratios and risk differences, doesn’t apply.
I agree with the heterogeneity argument but that applies to all measures and I was bringing the focus back solely to interpretation assuming homogeneity. The main point I am trying to make is that, yes, it is a ratio and can (and has) been interpreted as a ratio of two risks which is what is accepted by the community of researchers. But then by the same consideration can we call a ratio of likelihoods in diagnostic testing a risk ratio since it is numerically the ratio of risks? The only thing that distinguishes them is interpretation unless someone can point out something else. I think the point here is clear and the question is which of [1] or [2] is correct?
Pr(S+ | T+) / Pr(S+ | T-) = RR … [1]
Pr(S+ | T+) / Pr(S+ | T-) = L(T+ | S+) / L(T- | S+) = LR … [2]
I don’t understand that argument.
Yes heterogeneity affects all measures; it just causes more problems in the binary Y setting.
This argument has been made previously by Jeffrey Blume Stat Med 2002 Sep 15;21(17):2563-99 but not in the context of effect measures.
To make it clear lets take the example of coin flips
The probability of x heads out of n flips is given by:
Pr(X=x) = K · P^x · (1-P)^n-x … [1]
where K depends on the value of x & n only
Also
L(P | x, n) = K · P^x · (1-P)^n-x … [2]
The only difference between [1] and [2] is that in [2] K is a constant across values of P when n and x are held constant while when P and n are held constant and x varies then K takes on different values. The sum of Pr(X=x) over all possible values of x (and thus K) is 1 but not so for the likelihood
This explains why K cancels for the likelihood ratio interpretation but not for the probability ratio interpretation and what follows then defines all the points regarding the RR (probability ratio interpretation) in my previous post
That look good but I don’t understand your angle. You can bring in all kinds of issues but a ratio of probabilities is still a risk ratio.
