When speaking of the choice of an effect measure, I believe we are talking about a default choice, i.e., a choice that has the greatest chance of being useful and the lowest chance of being misleading. Based on a wide variety of datasets, the OR would be my default choice as a relative effect measure as it has the highest probability of being constant, so has the lowest apriori probability of being misleading. Your mileage may vary.
3 Likes
What does this even mean? What is your probability space?
Is this a frequentist statement about the prevalence of “between-group effect measure stability”, when considering the cartesian product of all possible ways that we can partition populations into groups, and all exposure-outcome relationships? Or some other frequentist formalization? If so, where is your empirical evidence?
Or is this a Bayesian statement about Frank Harrell’s personal priors? If so, we are talking about a highly informative prior distribution, one that is completely unresponsive to argument. It is unclear to me why anyone would be interested in knowing where probability mass is assigned in this distribution. In order for this prior to be well-calibrated to reality, it would be very important for the Bayesian agent to to engage with arguments and update the distribution accordingly. It is very obvious to the world that this is not attempted.
You missed my points. I was speaking only practically based on a career of analyzing data. Since I’ve found that ORs are the most constant quantities over patient types I usually just have to model exceptions, which is easily done using interactions in logistic models.
2 Likes
I think there is a gross misconception in this thread about the term “dependence on baseline risk” of an effect measure. In various threads I have called it either the latter or “non-portability across baseline risk”. I believe that this has been interpreted to imply that we mean the difference between the sample averaged treatment effect (SATE) and the target population average treatment effect (PATE). This is not the case at all.
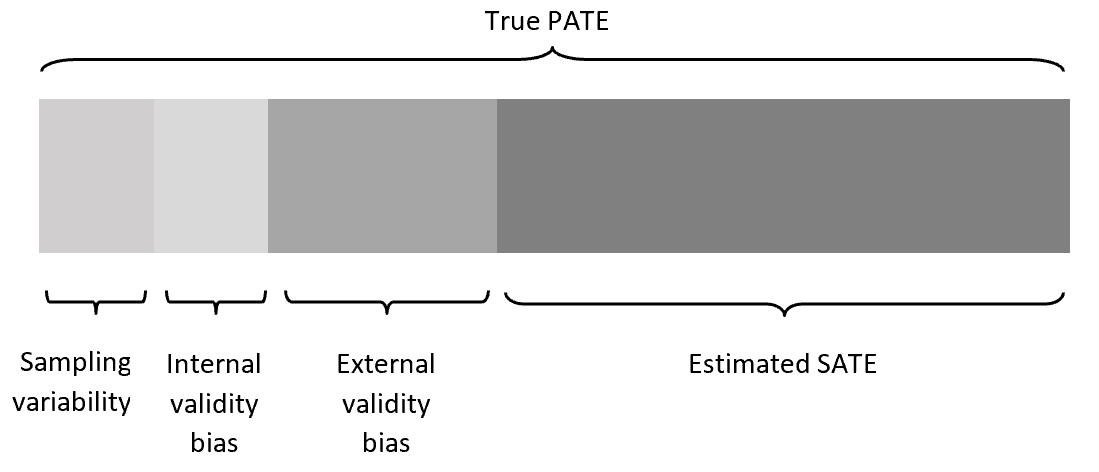
We (I am assuming Frank as well) have no interest in sampling variability, internal validity bias or external validity bias in this thread and this is what has been assumed in many of the arguments that have been put forward and attempts to interpret this from a causal inference framework. While there are certainly implications for the causal inference community that is not at all the primary purpose of the paper that started this thread.
What is being argued here and what exactly is meant by “portability” in the paper that started this thread is that an effect measure is non-portable if the value of prevalence of the outcome in a study sample determines the magnitude of the SATE independent of the actual association between treatment and outcome. I note here that I use prevalence as that is what the paper notes is the important metric but since prev and baseline risk are related then this applies to baseline risk too.
To illustrate the difference this makes I take the same 140 thousand trials I scraped from Cochrane (with both a binary treatment variable and a binary outcome - 140,620 trials to be exact). I then computed the discrimination of outcome by treatment (would be the same for treatment by outcome as well) based on Stephen Walter’s equation and this then is our discrimination standard against which logRR and logOR can be compared across baseline prevalence and below is what we get:
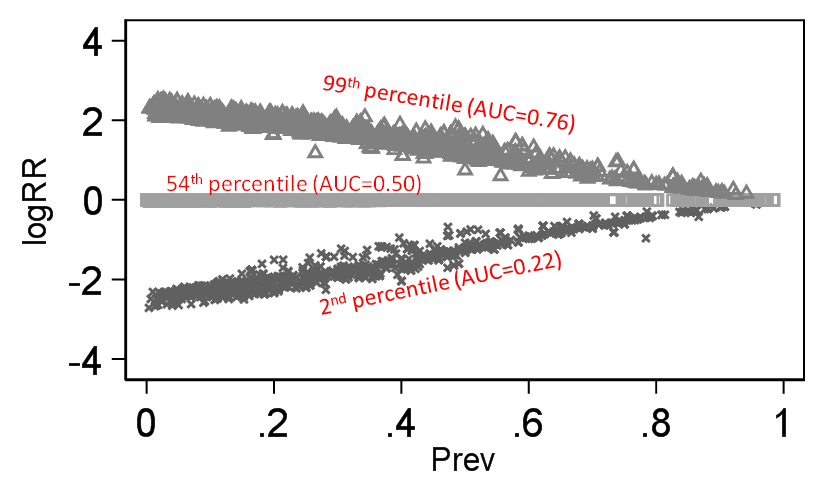
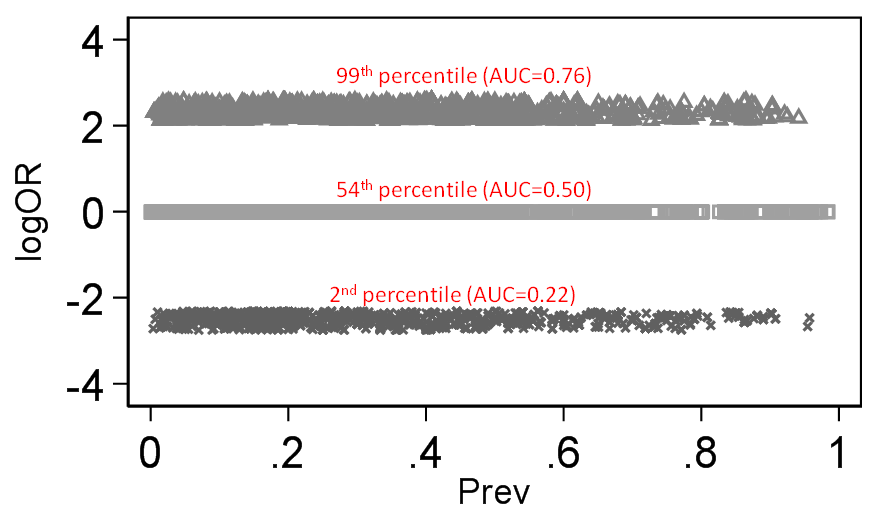
There is little doubt that the magnitude of the RR depends on outcome prevalence and OR does not. By “depends on” what is meant here is that the degree of association (as judged by an index of discrimination) becomes secondary for the RR because its mathematical property demands that it also changes value when outcome prevalence changes.
Perphaps you have little doubt about this claim. But that is the entire problem: The claim is not true, yet you take it as an unquestionable article of faith.
Again, practical experience disagrees. It’s not of matter of one metric being always wrong or always right. It’s a matter of what is a good choice for the majority of applications.
3 Likes
The discussion I am having with Doi is about theory. He is making false theoretical claims, I am rebutting them.
If you think the disagreement can be settled by “practical experience” I am going to insist on your receipts. Did you analyze all those datasets using both the odds ratio and the switch relative risk? What criterion did you use to determine what was the “best choice” for each application?
Criterion for best choice: the metric inducing the fewest number of exceptions (interactions).
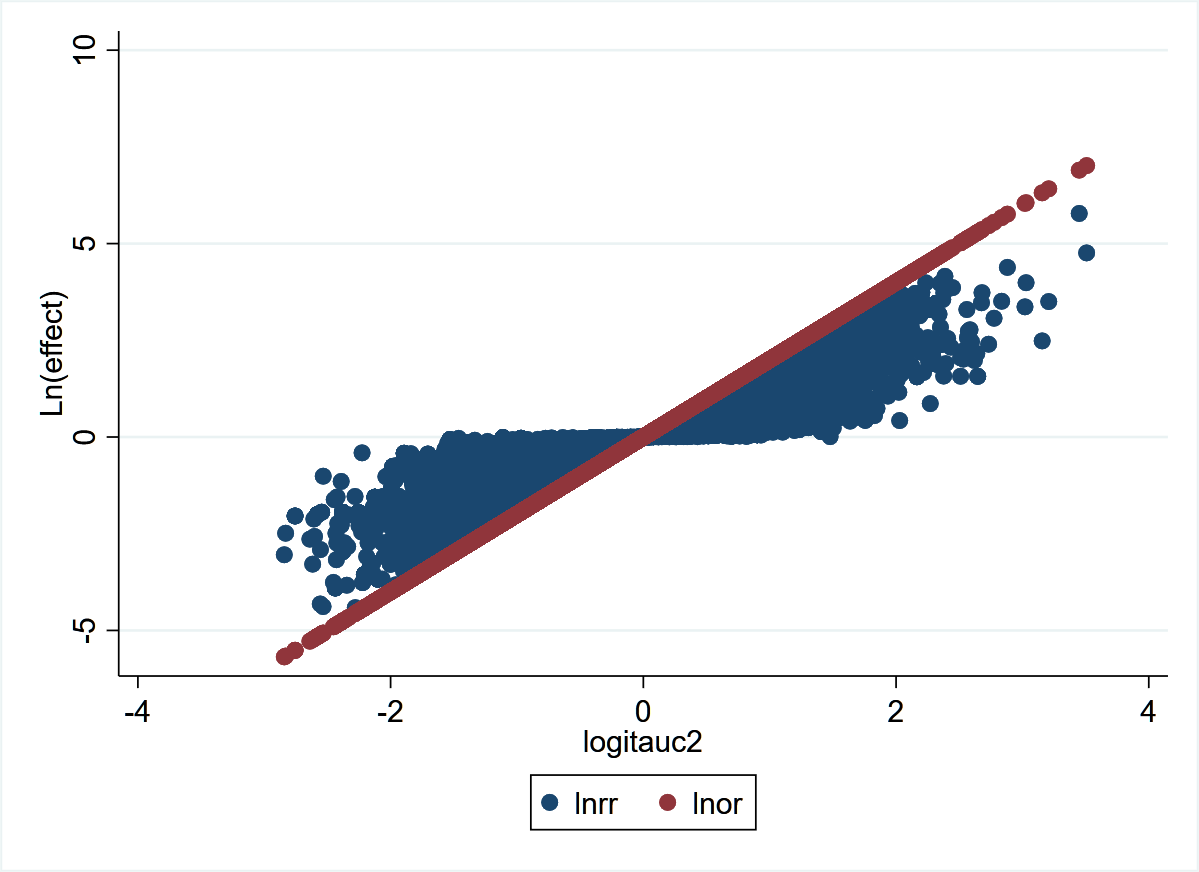
This graph from the 140,620 trials demonstrates more clearly the concepts stated previously. LnOR is linear with logit(AUC) and not so LnRR. This also explains a discussion on Andrew Gelman’s blog where he says that the coefficient on the logistic scale corresponds to different shifts in probability, depending on where your baseline is - which is true. The converse is also true that for the same shift in probability, the OR may be different depending on where your baseline is. For example:
0.2 –>> 0.4 = OR 2.67
0.4 –>> 0.6 = OR 2.25
0.6 –>> 0.8 = OR 2.67
This graph explains why - discrimination depends on where your baseline is for the same shift in probability.
1 Like
Very few people think about randomized trials in terms of “AUC”. If you are going to base your argument around this construct, could you at least please define the specific AUC that you are considering? I understand that you imagine using the outcome as a test for whether a patient was treated. But what specific ROC curve are you considering? How do you get more than one point on the curve? I don’t understand in what sense you can vary the positive test threshold value in your hypothetical diagnostic test, given that the outcome is binary.
Regardless of all this, as I have tried to tell you a couple of times: Unless you can establish that AUC is stable between groups with similar baseline risk, this is just a mildly noteworthy mathematical relationship, with no implications for whether any effect measure “depends on baseline risk”. For the argument to work, you first have to establish why you expect AUC to be stable across groups with different risk
2 Likes
Though AUC is relevant I’d like to see it de-emphasized in this discussion.
3 Likes
I understand that in your RMS book you have suggested alternatives to AUC in the context of risk prediction modelling, Here I am not referring to risk prediction modelling but rather, as Jonathan Bartlett has suggested, I am using the AUC to represent the probability that the model (with only the treatment) correctly ranks pairs of randomly selected observations, one with Y=1 and the other with Y=0. Then it is easy to show that logOR is linear with logit[Pr(correct_rank)]. What other options do we have to quantify discrimination of a binary outcome by treatment status independent of the three binary effect measures?
1 Like
Is there a way to calculate Somers D from a 2x2 table from a clinical trial?
Addendum
Figured it out:
if pA = Pr(Y = 1|X = 1), pB = Pr(Y = 1|X = 0)
then
D(Y |X) = pA − pB
Therefore
AUC = (D+1)/2
I see where the c-index (AUROC) is useful for describing the overlap between treatment groups in an outcome variable. It is unitless and pretty easy to interpret. But let’s not stop there. Log-likelihood-based measures such as pseudo R^2 should also be considered as well as measures related to predicted risk dispersion (though this is more for the continuous X case, not the 2-treatment case).
1 Like
I will look at McFaddens R2 as well though I now find that Somers d based AUC and Walters’ SROC based AUC do not correlate strongly at all so I wonder which is right? I suspect that the problem is with Somers d - is there any literature on this?
I will compare the SROC based AUC with McFaddens R2. I don’t really know how to compute this from aggregate data so I may have to analyze each study in a GLM and extract this from the regression output but if I set up such a loop in Stata my guess is it will take a week to complete unless there is an alternative?
1 Like
It gets confusing whether to use Somers’ D_{xy} or D_{yx} here. Also take a look at R2
The link was informative - will probably try out one of the R2 indices and compare this to Walters Q. I think the comparison using these indices as a benchmark will help clarify things.
You can spend as much time as you want playing around with the relationship between different measures of association, including ones that do not play any obvious role in the analysis of randomized trials, such as Somer’s D and R2. Perhaps you can even identify some previous undescribed relationship between these constructs and the odds ratio.
I am not going to rule out that there might exist statisticians who would find this to be an interesting exercise. However, unless you can establish that one of these constructs will be equal between groups with different baseline risk, it will have absolutely no implications for the discussion in this thread.
Now we’re getting somewhere!
Dear Dr. Doi,
Thank you for your letter regarding the Huitfeldt paper that appeared ahead of print yesterday on the Epidemiology web page.
I am happy to accept your letter for publication. I will invite the authors of the original paper to contribute a response, to be published concurrently.
Thank you for your contribution to the journal.
Best regards,
Timothy L. Lash, DSc
It will be of great interest to see what argument is put forward to the letter I posted above
1 Like