Time for a change in language: statistical divergence and the 95% non-divergent interval (95%nDI)

We are writing a position paper on the use of p values and confidence intervals on behalf of the M-CPHR RNG group (Methods in Clinical and Population Health Research - Research Network Group) and have come to the conclusion that there is a radical need for a change in terminology rather than a change in scale of the p value as suggested by @Sander and others or a replacement for the p value as some have suggested. We agree with @Stephen that the real problem is making an idol of the p values. In addition a radical rethink of confidence intervals is required and we have suggested that a non-divergent interval be proposed (e.g. 95% nDI) and this is illustrated below with reconceptualization in terms of percentile location on a model. We considered compatibility and uncertainty intervals as suggested by Sander and Andrew but finally decided to offer the nDI as the simplest way forwards in terms of a language change. I know that a while ago @f2harrell asked the question ‘Challenge of the day: suppose a randomized trial yielded a 0.95 confidence interval for the treatment odds ratio of [0.72, 0.91]. Can you provide an exact interpretation of THIS interval?’
Perhaps the 95%nDI answers this question as illustrated in the graph below (sample data with mean 10 and SE 1):

Fig1_new png

I would need to see an interpretation of this that a non-statistician would understand before I favored this terminology. And I’m not seeing what’s wrong with compatibility interval.

1 Like

The 95%nDI of [8,12] is interpreted as indicating the possible range of effect models on which the location of the observed test statistic is less extreme than their 2.5%tile value for any symmetrical pair of models in that interval.

There is nothing wrong with compatibility intervals (probably the best recommendation thus far) but we could not reconcile a common language across p values and confidence intervals using ‘compatibility’ and therefore one term had to change - we then decided to drop compatibility and adopt nDI as it would perhaps be the easiest linguistically across both. Note the aim here is to get us out of this interpretational misuse - we have no problem with the core concept except that in hindsight I think NP creating the decision-theoretic framework did more harm than good for interpretation in common use.

1 Like

I’m not sure I grasp this - neither the explanation or graph is intuitive to me.

For the physicians I work with who are used to confidence intervals (even though often misinterpreting them) the questions would arise: “divergent from what?” (as they would also ask “compatible with what?”)

This is exactly the question this terminology was meant to elicit - divergent from what? Divergent from the hypothesized effect model. If the hypothesized model was the null model then the data collected are divergent from it.

The graph shows data from which a mean of 10 and SE of 1 has been obtained. Say this is a mean weight loss of a selected group of people after a specific treatment. The horizontal capped lines are the nDIs (previously known as CIs) at different percentage levels (previously known as confidence levels). e.g. the one corresponding to 95% nDI is also what was previously known as 95% CI. The scale next to the percent nDI scale shows the location of the data on the model (at the limit of the interval) in percentiles. So for the limit of the 95% nDI this is the 2.5%tile. The solid curve is the model whose parameter value equals the mean from the data.

Now that the graph is explained, the interpretation: The 95% nDI is approximately [8, 12] (from the graph). Therefore models whose parameter values are between 8 and 12 are statistically non-divergent with the data (at the 5% divergence level, formerly significance level). The classic interpretation is that “if we were to replicate a study of this size multiple times and get multiple CIs, then 95 % of such intervals would be expected to contain the ‘true’ parameter”. The classical explanation is about SUCH intervals and we have no idea if THIS interval captured the population parameter. The %nDI is about this interval and therefore we can infer that since 8,12 extends to the 2.5%tile location on the model, this is the likely range of models ‘compatible’ or ‘non-divergent’ with the data. We could still be wrong given that this is a 2.5%tile location. This also means that if our null hypothesis is about no weight loss, then since 0 is not in this interval, a model with mean zero is divergent from the data, hence this is a statistically divergent result. In the past we would have said that this is a statistically significant result. The problem is that since ‘significance’ has a clear English language meaning of importance, the statistical implication was lost (much less likely to ask the important question - “significant from what?” and just assume importance).

As the percent on the nDI declines, it means the divergence threshold (formerly significance threshold) is being made less extreme and therefore the width of the interval declines and when the % is zero the interval has no width [10,10] because the percentile location is 50%tile and there is no test statistic less extreme than this. In other words, if the divergence level (formerly significance level) is set to 100%, there can be only one model (the model shown as a curve where the test statistic sits on its location boundary) and no others.

1 Like

This graph might clarify things: If we imagine the models as the dashed lines depicting sampling distributions, the range of model means non-divergent with the data are the models with means starting from the left panel (at the lower limit of the nDI) and as the sampling distribution slides to the right (mean increasing till it hits the upper limit of the nDI), those are the range of models in the nDI non-divergent with the data. The location of the sample mean on the left model is at its 2.5%tile location and then as this is slid across it moves to the 50%tile location and then back to the 2.5%tile location on the right. We no longer need to worry about probabilities, and the range of models on which the data is located on the 2.5%tile or less extreme location are the models non-divergent with the data. Models with means less than 8 e.g. 0 would be interpreted as divergent with the data meaning that at our divergence level we should begin to question that model as the data generating mechanism and perhaps consider an alternative to it. If we were to select a null hypothesis as one of those models to a more extreme left position than the model on the left panel, a computed p value would now be <0.05 meaning the sample data is statistically divergent at the 5% divergence level with respect to our chosen null hypothesis. There are several advantages here of this terminology:
a) Statistically divergent and nDI are unified in terminology
b) we keep doing things the same way e.g. statistically divergent result resonates with people used to statistically significant result
c) We therefore just need to change one term but not how it is used

three plots png

Dear Dr. Doi,

Thank you for sharing your work. I appreciate the initiative of replacing ‘statistical significance’ with ‘statistical divergence.’ After a first glance, I present some major criticisms that I hope are constructive.


“Although Fisher’s framework was one of inference, Jerzy Neyman and Egon Pearson tried to move this to a decision framework later on 5 . Regardless of framework, at its core, the p value is a measure of validity of the chosen hypothesis as a source of the study data.”

I believe two key issues must be emphasized. First, the P-value is derived from a model presumed to be perfectly valid before calculation. Thus, the validity of the very P-value as a measure of the relationship between the data and a specific mathematical hypothesis (e.g., the null hypothesis) is conditional on the plausibility of the remaining assumptions that make up the chosen model (e.g., data normality, absence of outliers, linearity, etc). Moreover, there could be numerous different models (and therefore hypotheses) capable of yielding similar P-values (and these P-values ​​cannot ‘tell us’ which of such models is more - or less - valid). Consequently, considering the P-value as a measure of the validity of a mathematical hypothesis as the source of the observed, numerical data is an overestimation of its capabilities. This problem further amplifies when assessing a scientific hypothesis (e.g., absence of a drug effect), since the underlying validity request encompasses scientific and epistemological assumptions (e.g., absence of human bias, appropriate study design, correct setting of measurement instruments).

Secondly, the Neyman-Pearson decision P-value is not designed to provide information about the contextual properties or characteristics of the chosen hypothesis: it is merely an intermediate tool for making a decision based on a rule of behavior - disconnected from the statistical evidence of the individual study - that gains practical significance (i.e., to limit Type I errors to α*100%) only through a high number of valid, equivalent replications. As recently shown by @Sander, it is essential to clearly distinguish between the divergence P-value and the decision P-value, not only for semantic reasons but also for procedural ones (e.g., the inadequacy of the latter in TOST procedures) [1].

In light of this, I propose that the sentence under consideration and all similar expressions or concepts be removed or substantially reformulated.


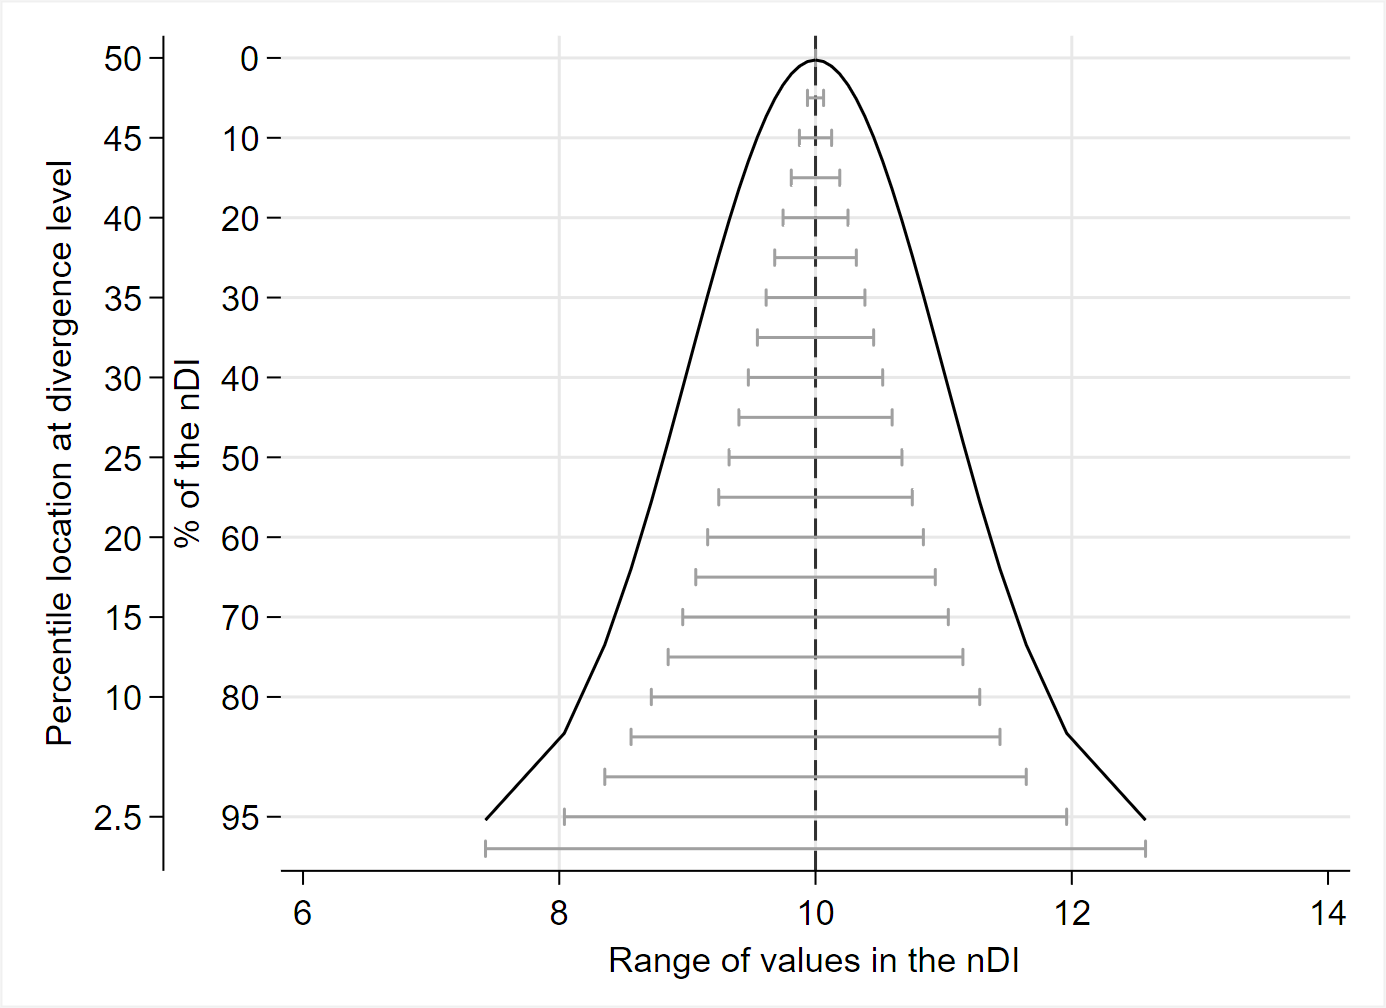
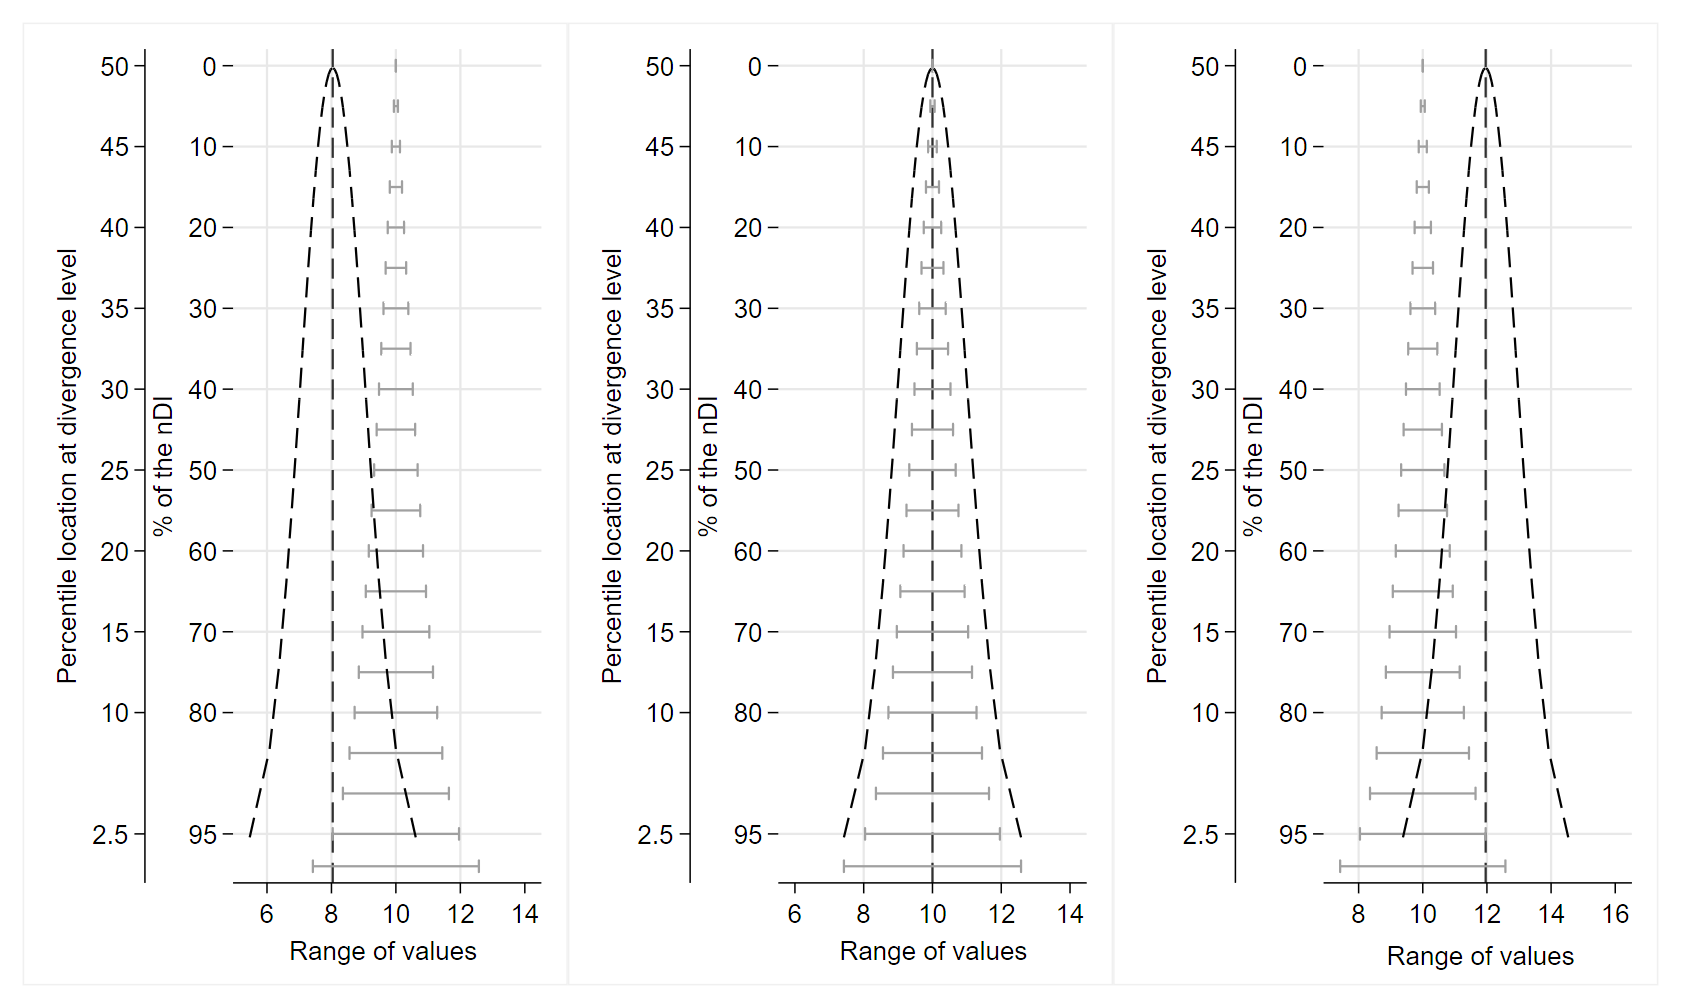
“For clarity we propose the following use of the terms: a) Statistically divergent: When the p-value is less than the divergence level (e.g. two sided p < α). b) Statistically non-divergent: When the p-value is greater than or equal to the divergence level (e.g.,two sided ≥ α). c) Non-divergent interval (nDI): The interval associated with the stated divergence level, usually 95%. d) Continuum of p-values: represents the degree of divergence of the hypothesized model with the data, usually trichotomized44 to no, weak and strong divergence. Divergence can also be used to indicate distance from the divergence threshold e.g. approaching statistical divergence.”

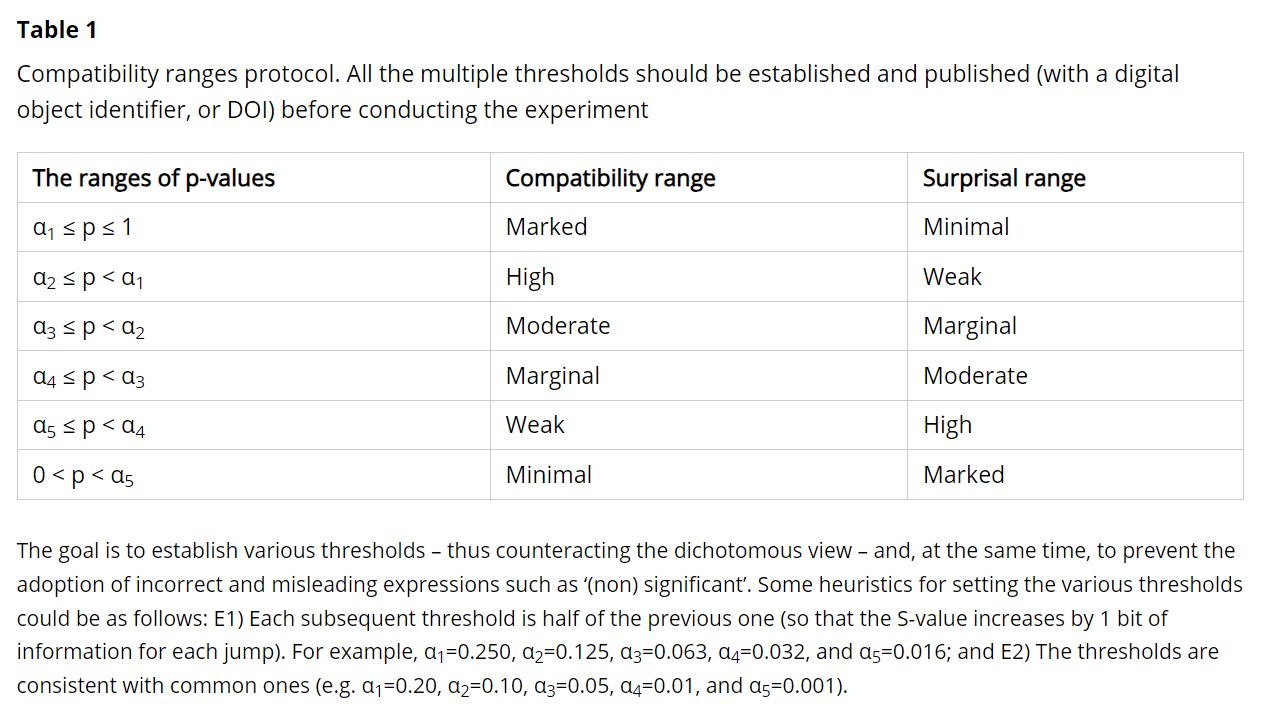
This proposal simply shifts the problem of dichotomization from ‘statistical significance’ to ‘statistical divergence.’ However, this can generate further confusion as the definition of ‘statistical divergence’ - unlike that of ‘statistical significance’ - is linked to an objective, measurable quantity: The mathematical-geometric discrepancy of the experimental test statistic from the model’s prediction. In particular, asserting ‘non-divergence’ means claiming that the test statistic is exactly equal to 0 (in any other case, non-zero divergence exists). At most, one can speak of the ‘relevance’ or ‘strength’ of the divergence, the evaluation of which depends on the scientific context (e.g., prior information on previous evidence and costs, risks, and benefits) [2].

Accordingly, I suggest a modification: from ‘non-divergence interval’ to ‘less-divergence interval.’ For instance, a 95% LDI contains all the mathematical hypotheses related to a real effect or association that are less divergent with the data (P ≥ 0.05) than those outside the interval (P < 0.05), as assessed by the chosen model. In this regard, I also emphasize the importance of adopting methods to address the scaling problem of P-values in quantifying the refutational-information content of the divergence statistic (e.g., Shannon information, i.e., the log-transform of P-values into S-values) [1]. For example, in both statistical and information-theoretic terms, P = 0.005 represents relatively large divergence whereas P = 0.16 does not, but at the other end of the P-value scale, P = 0.84 and P = 0.995 both represent very little divergence even though they are the same ‘distance’ apart on the scale (i.e., 0.995 - 0.84 = 0.16 - 0.005 = 0.155). Upon taking their negative logarithms, as done for example in Shannon-information theory, using base 2 logs of P (S-values) we see that P = 0.005 (S = 7.6) represents 5 more bits of information against the model than does P = 0.16 (S = 2.6), whereas P = 0.84 and P = 0.995 both represent less than half a bit of information against the model [1]. The S-value is thus a measure of the information divergence of the data from the model.


“[…] we could not reconcile a common language across p values and confidence intervals using ‘compatibility’ […]”

Yet this reconciliation is done in some articles cited in your paper and is very simple: A Fisherian (divergence) P-value is an index of compatibility of the data with the tested parameter value, given the model, and a 95% CI is the compatibility interval which shows all parameter values that have P ≥ 0.05 and thus are more compatible with the data than those outside the interval (P < 0.05). That shows how the common language for compatibility that connects interval estimates to P-values. This connection is all the more reason to link your proposal to ‘compatibility’ terminology, because divergence can then be seen as a degree of incompatibility and a degree of nondivergence can be seen as compatibility. I honestly believe that the term ‘compatibility’ fits even better than the term ‘divergence’ since high (resp. low) P-values ​​correspond to high (resp. low) compatibility; On the contrary, high (resp. low) P-values ​​correspond to low (resp. high) divergence. Nonetheless, your proposal has merit as long as the terminological scenario is presented in an impartial, complete manner.


As a final note, I recommend paying closer attention to the history of statistical testing and avoiding overattributions of ‘statistical significance’ to Sir Ronald Fisher (a mistake I have made myself in the past). For example, Karl Pearson mentioned the ‘significant vs. non-significant’ dichotomy as early as 1906 (p.181 and p.183) [3]. Furthermore, the concept of the P-value was already quite common in the French literature by the 1840s - so much so that later in the 19th century there were subsequent complaints about what we now call ‘P-fishing’ (see sec. 2.4 and 3.7 of Shafer) [4].

I really hope this helps.

Best regards,
Alessandro Rovetta


REFERENCES

  1. Greenland, S. (2023). Divergence versus decision P-values: A distinction worth making in theory and keeping in practice: Or, how divergence P-values measure evidence even when decision P-values do not. Scand J Statist, 50(1), 54–88. DOI: 10.1111/sjos.12625

  2. Amrhein, V., & Greenland, S. (2022). Discuss practical importance of results based on interval estimates and p-value functions, not only on point estimates and null p-values. Journal of Information Technology, 37(3), 316-320. DOI: 10.1177/02683962221105904

  3. Pearson, K. (1906). Note on the Significant or Non-Significant Character of a Sub-Sample Drawn from a Sample. Biometrika, 5(1/2), 181–183. DOI: 10.2307/2331656

  4. Shafer, G. (2019, September 28). On the Nineteenth-Century Origins of Significance Testing and P-Hacking. DOI: 10.2139/ssrn.3461417

2 Likes

Thanks Dr Rovetta, I will raise these points with the MCPHR group and see what consensus emerges. Indeed, we posted it here and on RG to get feedback and suggestions like yours. I will proceed to add my thoughts on some of the issues you have raised.

  1. I agree fully that the assumptions must be met and we said that up front (…if every model assumption were correct, including the models effect hypothesis) and when we say “…at its core, the p value is a measure of validity of the chosen hypothesis as a source of the study data” we refer only to the hypothesized model - that is one model. I think the disclaimer and the “chosen” model comment may address the first point you have raised and minimizes any misinterpretation that could ensue. Nevertheless point taken and I plan to edit that to bring the assumption concern up early: “… at its core, the p value is a measure of validity of the chosen hypothesis as a source of the study data assuming every model assumption is correct

  2. The second major point that you raise is that we retain the dichotomization implied by statistical significance. Yes, that we do as the aim is not to change the system but to change the language and keep in mind this is aimed at clinicians and what we want them to do is to ask the simple question “divergence from what?”. Clinicians are naturally inferential decision makers and that question has already been asked on this thread but needs a better answer than the one I have posted above. The new preprint now has a better answer in Figure 3. That would be the first step in rectifying the problem. In summary you are right, this proposal simply shifts the problem of dichotomization from ‘statistical significance’ to ‘statistical divergence’ but stops short from a critique of dichotomization. The group consensus was that we need only address the most important issue at this point which is equating significance to importance etc. You have a good point about the relevance of the divergence and perhaps we need to think more about that. Shifting from “non-divergent” interval to “less-divergent” interval means we are also dropping the dichotomization as less divergent implies no threshold. I will seek consensus on that but my feeling is that the group will see this as a step too far from current usage of significance and that will then require a great deal more explanation.

  3. Your third point about re-scaling p values is one that @Sander prefers but we are focusing here on linguistic misuse and not changing the structure of the p value. I agree fully with you that S values represent the divergence more intuitively than p values but this seems to me less of a priority at this stage of the problem. Perhaps another paper if this bid for change is successful.

  4. Regarding compatibility, I fully agree that with the interval it makes perfect sense. But we also needed a replacement for significance that also aligns with the interval term. Do we call a significant result a “statistically incompatible” result? Then we are back to the language misuse as incompatibility had so many misconceptions in our earlier meetings that the easiest thing to do was drop the term, which we did. I doubt if we can use compatibility outside the interval notation to resolve the misuse.

  5. Finally, I agree with you about the history and we will look up the reference you provided to correct the record. Alternatively we could also say that Fisher formalized what others had already developed - which is true.

How is the “non-divergence interval” mathematically semantically different from either the conventional confidence/compatibility interval or a confidence/compatibility distribution (the set of intervals where \alpha ranges from 0-1)?

I can find no reason to argue with @Sander with the use of either the term “compatibility” or the log_2 transformation of the p-value. They are all very short derivations from definitions of stats 101 or information theory. I suggested the use of the language “sufficiently surprising (conditional on model assumptions)” as an alternative to “significance” in the old language thread, as all the statisticians I have come across agree the log transform of a p-value is a measure of information known a the surprisal.

https://discourse.datamethods.org/t/language-for-communicating-frequentist-results-about-treatment-effects/934/176

I initially found the idea of evidence being a random quantity rather strange, but I have come to accept it as being a valid perspective, especially in the design phase of an experiment.

Sufficiently surprising is good as well but we wanted the same term across significance and confidence and hence the choice. In terms of mathematical semantics there is no difference but we now use language that cannot be misused to mean something else that is the major problem that led to all this. On RG many commentators suggested that we should educate doctors rather than change language. I think we should change language so that self education can proceed through inquiry.

I will summarize an interesting post from RG:
To summarize, Wim Kaijser says that fixing terminology will not work without fixing the ways people reason from data and Scott D Chasalow says that fixing terminology is not sufficient but that it does not mean that we cannot do both i.e. they are not mutually exclusive so we can change terminology and fix the way people reason from data. The point I am raising is that we should fix the way people reason from data but to pragmatically achieve that, we must fix the terminology otherwise the second task is too onerous and probably is why we are where we are. There have been no real attempts to change terminology in this clear and determined way so this might work.

1 Like

Dear Dr. Doi,

I am glad that you found my suggestions useful. I don’t fully agree with everything you wrote, but I completely share and support your intention to find the right balance between accuracy and effective communication.

In this regard, I feel compelled to emphasize one point: you write

“[…] what we want them to do is to ask the simple question “divergence from what?”

I use your argument, which I agree with, to reinforce the following point regarding less-divergence intervals: what we want them to do is to ask the simple question “less divergent than what?” (answer: less divergent - from the experimental data - than the hypotheses outside the interval as assessed by the chosen model). And, subsequently, to the question “how much less divergent?” (answer: P ≥ 0.05 for the 95% case, P ≥ 0.10 for the 90% case, etc.)

Regarding the S-values, I understand the intent to avoid overcomplicating things. Nonetheless, I suggest reading the section “A less innovative but still useful approach” in a recent paper I co-authored with Professors Mansournia and Vitale (we have to thank @Sander , @Valentin_Amrhein , and Blake McShane for their essential comments on this point) [1]. Specifically, what concerns me is correctly quantifying the degree of divergence, which can be explained intuitively without the underlying formalization of the S-values***.

All the best and please keep us updated,
Alessandro

*** P.S. What is shown in Table 2 of the paper can be easily applied to individual P-values by considering their ratio with P = 1 (P-value for the non-divergent hypothesis). For example, P = 0.05 → 1/0.05 = 20. Since 20 lies between 16 = 2^4 and 32 = 2^5, we know that the observed statistical result is more surprising than 4 consecutive heads when flipping a fair coin but less surprising than 5 (compared to the target hypothesis conditionally on the background assumptions).

REFERENCES

[1] https://doi.org/10.1016/j.gloepi.2024.100151

1 Like

Thanks for the update. This is indeed a good way of thinking about the interpretation of the p value. What do you think about the location interpretation and saying that the test statistic from the data had a 5th percentile score under the target model? Do you see this as equally intuitive?

The other points you have raised are being discussed and we will see what the consensus is.

Dear Dr. Doi,

The point I wish to emphasize here is not only the intuitive aspect (which, obviously, has a margin of subjectivity) but the statistical information contained. Indeed, in the descriptive approach (highly advisable in the soft sciences), the interpretation of the P-value as “the probability of obtaining - in numerous future equivalent experiments in which chance is the sole factor at play - test statistics as or more extreme than the one observed in the experiment” falls away (since it is implausible - if not impossible - to guarantee that equivalence). All it can ‘tell us’ in this mere sense is how surprised we should be by a numerical result compared to the model’s prediction.

In this regard, since information does not scale linearly but logarithmically, using the P-value ratio also leads to a distortion of the contained information. For example, P1 = 0.02 might seem to indicate a much higher condition of rarity than P2 = 0.08 (since P2/P1 = 4); however, these are two events whose ‘difference in surprise’ is equivalent to only 2 consecutive heads when flipping a fair coin.

Therefore, I don’t believe that the expression “the test statistic from the data had a 5th percentile score under the target model” is sufficiently intuitive from this standpoint (although it accurately expresses the location on the curve of the associated distribution). Indeed, the key question remains: how much refutational, statistical information is contained in that percentile?

A possible compromise could be to publish a pre-study protocol defining various ranges of compatibility/surprise (I recently published on this topic: https://doi.org/10.18332/pht/189530) for P-values (attached image). Obviously, like you and your colleagues, I am also experimenting to find a solution to the misuse of statistical significance.

From my knowledge and personal impressions, I can say that I find your idea valid, provided that the issues I raised are adequately addressed (not necessarily through my suggestions alone, but also through other alternative approaches, perhaps better than mine!)

All the best,
Alessandro

image

1 Like

Thanks Dr Rovetta,

These are valid points and the dilemma now is where do we go from here regarding two main points - naming the interval in language that is unambiguous in terms of interpretation and using correct language regarding p values that makes the interpretation explicit and meaningful as has been attempted in your Table above. I have discussed these discussions on the blog with methodologists in the group (especially around naming the interval although this has flow on implications for what we call statistically ‘non-divergent’ too) and the recommendations vary considerably amongst them understandably so because we each have our own cognitive biases. The group also consists of a large number of Y3 and Y4 medical students as well as doctoral students and residents and I am meeting up with them later today. I think the most pragmatic plan is to give them the options and leave it to them as they represent the next generation users of these terms. We could of course move this in a particular direction, but since we remain uncertain of what will eventually work its best that an unbiased group pitch in now that all discussions have happened both here and on RG - which they also are reading and generate ideas that are convincing. Once this meeting is held, if there are any changes adopted, I will update the results here as well as in an update to the preprint on RG.

I hope you’ll give them Bayesian alternatives that will be simpler for them to understand and that don’t require inference or hypothesis testing. You can just think of playing the odds in decision making. You don’t have to conclude that a treatment works; you might act as though it works and compute the probability that you are taking the wrong action, i.e., one minus the posterior probability of efficacy.

Hi Suhail

For what it’s worth (probably not much :slight_smile: ), as a family physician without extensive training in epi/stats, I had trouble understanding the new proposal. I did, however, find the explanations in the following article to be quite clear. S values seem at least somewhat intuitive to non-experts:

I suspect that any concepts more complicated than S values will be hard to teach to an audience without a graduate degree in epi or stats.

Bayesian presentations of trial results often, but not always https://discourse.datamethods.org/t/multiplicity-adjustments-in-bayesian-analysis/2649), feel easier to grasp. But I’m not sure that there are enough instructors who are expert enough with these methods (“how the sausage is made”) to teach them correctly to a clinical audience (?) More worryingly, until a sufficient number of researchers deeply understand these methods, there’s a risk that they will produce studies that are ostensibly easier to interpret, yet clinically misleading (though there’s already plenty of bad practice in presenting frequentist results). Not an easy problem…

1 Like

I feel that way of thinking is not helpful because they misunderstand traditional statistics even worse. For examples many clinical trialists and NEJM editors still don’t understand that a large P value does not mean the treatment doesn’t work.

Hi Frank and Erin,
For now I am sticking with terminology around p values and CIs because it is so badly (mis)embedded in the thinking about EBM that this is the priority. Perhaps the time will come to extend this to the ways people reason from data - when terminology has become clear. I agree that the association of a large p value with no effect is very common in Medicine but it is more of expectation than anything to do with reasoning from data. This is so deeply misunderstood that even saying this would be akin to saying that a normal serum sodium concentration is 120mmol/L. People will just get up and walk out of the room. The difference is that in the case of p values they do not know that they don’t know because bad choice of terms continually reinforces what is wrong.

P-values and null hypothesis testing are defective concepts. That’s why we go round and round with workarounds, alternate wording, etc. Time to give up. Think of what a posterior probability P and 1-P give you - a built-in real error probability.