Dear Dr. Doi,
I am glad that you found my suggestions useful. I don’t fully agree with everything you wrote, but I completely share and support your intention to find the right balance between accuracy and effective communication.
In this regard, I feel compelled to emphasize one point: you write
“[…] what we want them to do is to ask the simple question “divergence from what?”
I use your argument, which I agree with, to reinforce the following point regarding less-divergence intervals: what we want them to do is to ask the simple question “less divergent than what?” (answer: less divergent - from the experimental data - than the hypotheses outside the interval as assessed by the chosen model). And, subsequently, to the question “how much less divergent?” (answer: P ≥ 0.05 for the 95% case, P ≥ 0.10 for the 90% case, etc.)
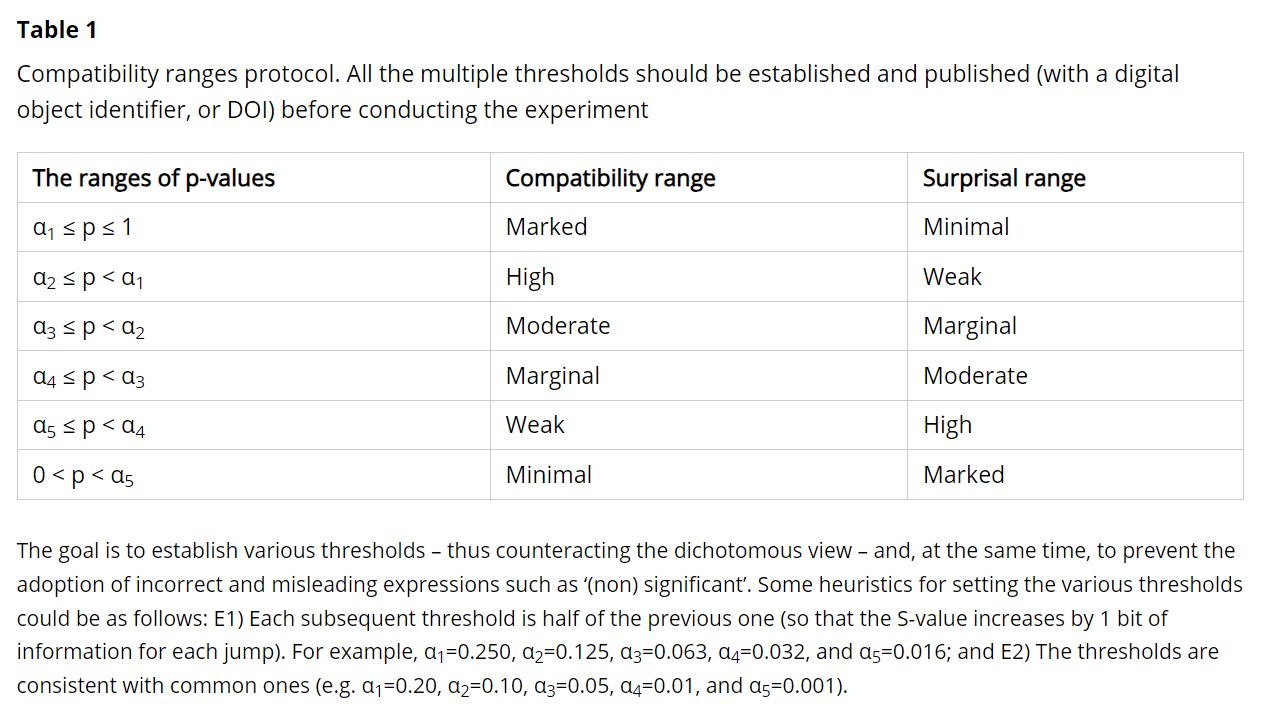
Regarding the S-values, I understand the intent to avoid overcomplicating things. Nonetheless, I suggest reading the section “A less innovative but still useful approach” in a recent paper I co-authored with Professors Mansournia and Vitale (we have to thank @Sander , @Valentin_Amrhein , and Blake McShane for their essential comments on this point) [1]. Specifically, what concerns me is correctly quantifying the degree of divergence, which can be explained intuitively without the underlying formalization of the S-values***.
All the best and please keep us updated,
Alessandro
*** P.S. What is shown in Table 2 of the paper can be easily applied to individual P-values by considering their ratio with P = 1 (P-value for the non-divergent hypothesis). For example, P = 0.05 → 1/0.05 = 20. Since 20 lies between 16 = 2^4 and 32 = 2^5, we know that the observed statistical result is more surprising than 4 consecutive heads when flipping a fair coin but less surprising than 5 (compared to the target hypothesis conditionally on the background assumptions).
REFERENCES
