This is a place to discuss this blog article which shows an example of a formal assessment of heterogeneity of treatment effect, shows how to use penalized maximum likelihood estimation to get patient-specific efficacy estimates, and discusses odds ratios, absolute risk differences, and risk ratios.
This topic is also the place to discuss this blog article which shows how personalization of efficacy estimates can result in worse estimates for individuals if HTE is not large.
i wonder then about some journals’ requirement for eg sex-specific estimates of the effect eg Circulation: “Please provide sex-specific and/or race/ethnicity-specific data when appropriate in describing the outcomes of epidemiologic analyses or clinical trials, or specifically state that no sex-based or race/ethnicity-based differences were present.” submission requirments. It’s not exactly clear if they’re alluding to a treatment interaction but i believe they are. As you note in the blog there is typically a serious lack of power, and thus the test it anti-conservative. The forest plot of ORs across subgroups that you describe would be a compelling visual however
The age-old NIH requirement was never quite appropriate because of the reason you mentioned Paul. This cannot be done reliably without borrowing of information, e.g., by putting a prior distribution on the interaction effect to assume that the response to tx for males is more like that for females than not. This Bayesian idea of having interactions “half in” and “half out” of the model is discussed well here.
I owe my OR love to @f2harrell and most of my day to day work being focused on whether or not HTE exists (as applied to systematic reviews). Will definitely be referring to this/adapting some of these visualizations for my own work.
it’s off topic ie not binary outcomes, but i wonder how one evaluates HTE with a rank-based composite. I’m not sure i’ve seen much literature on that, especially if you want to power on the interaction. In the social science literature they talk about “the adjusted rank transform test”. I’m not familiar with it and wondered if anyone had experience with this, maybe the probability index is used for the visual display and simulations for power estimation at the design stage… power est for composites seem tenuous anyway
Use the same methods as in the blog article but applied to a semiparametric ordinal regression model such as the proportional odds model (generalization of the Wilcoxon test).
I believe that the best over-arching approach is to develop a model that reliably estimates risk for individual patients then to use this model to estimate differences in risks for individuals. The model will typically be stated in terms of log odds ratios because this most often leads to the simplest model that fits, i.e., doesn’t require interactions to rescue lack of fit.
I don’t know a concise technical term for showing the whole distribution. To avoid being serious for a moment terms like “honesty” and “full disclosure” come to mind but we need some shorter version of “maintaining full conditioning to recognize that at least one effect measure must be covariate-dependent when the risk factor is not ignorable.”
The developer of R package {marginaleffects} is interested in posting a case-study about one of your posts on the distribution of risk difference. Do you allow it? With proper reference to your work, of course.
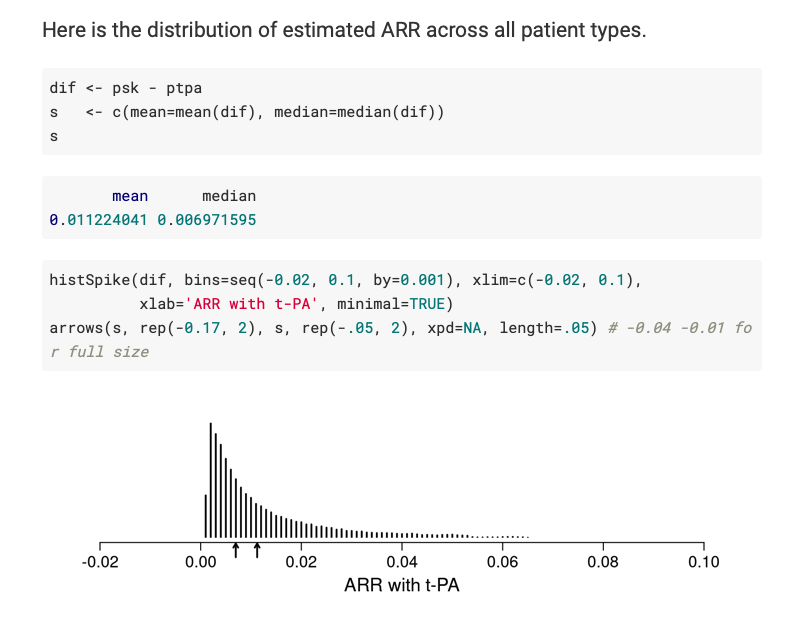
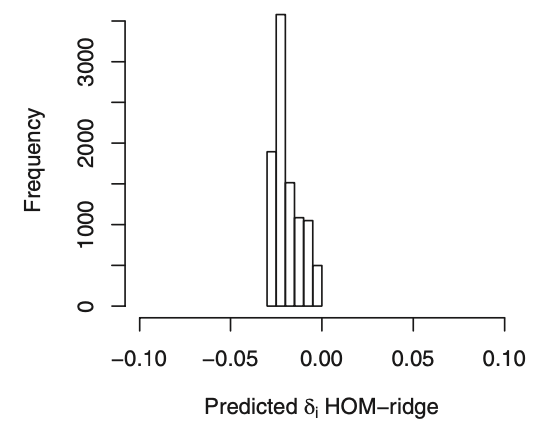
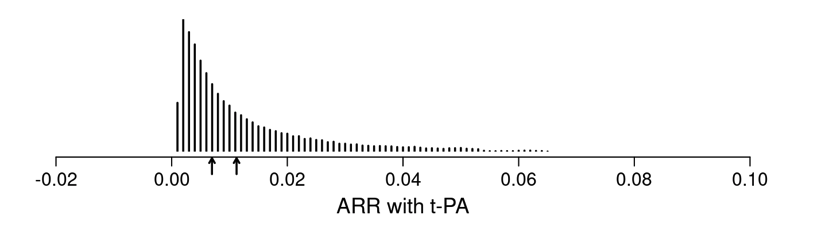
I want to double check with you that the first plot below (from your article’s Figure 4) corresponds to the estimated ARR distribution in your blog post (second plot below).
Please note I am not referring to the underlying logistic regression model. Instead, I refer to computing the predicted probability of an outcome for each observed row of the data in two counterfactual cases: when treatment is “tx==0” and when treatment is “tx==1”. Then, computing the differences between these two sets of predictions.