I will argue here that those males and females in the observation study must have been given advice based on the results of the RCT and that all the required information would have been available from the RCTs so that the observation study is not required. However, the RCT results had to be re-constructed by working backwards from the observation study. I will also address the point made by @ESMD that mathematical symbols should be linked to verbal reasoning in order to broaden discussions to make use of broader expertise.
The assumption that allowed this reconstruction was that the proportion of patients dying on no treatment in the observation study was the same as in the RCTs. Similarly, the proportion surviving on treatment in the observational study was in the same as in the RCT. This information can therefore be used to reconstruct what would have happened in the RCT if information about the nature of treatment was not available or had been withheld from the participants so that potential treatment choosers as well as those refusing had been randomised to be given treatment or no treatment.
There was clearly a big difference in the outcome of those patients choosing to take the treatment in the observational studies compared to those refusing, suggesting that it was not due to chance from some random or uninformed choice. This suggests that during the observational study, the choice was informed and based on advice as a result of what was discovered in the RCTs (or less likely known before the RCT was done but unethically withheld from the patients agreeing to participate). It can therefore be assumed that this knowledge would not have been available before the RCTs on females and males otherwise those patients who would be harmed or not helped significantly would have been excluded.
Disease severity is always known in patients recruited into a RCT. Those with minimal disease or very severe disease are usually excluded. Typically those with severe disease feel more uncomfortable and develop an unwanted outcome (e.g. death) more often than those with less severe disease and given the choice they would opt for treatment. For the sake of argument, the label {s} for severe will be applied to those who chose treatment in the observation study. However, the patient characteristic represented by {s} might have been something different (e.g. a known gene, DNA pattern or family history of anaphylaxis).
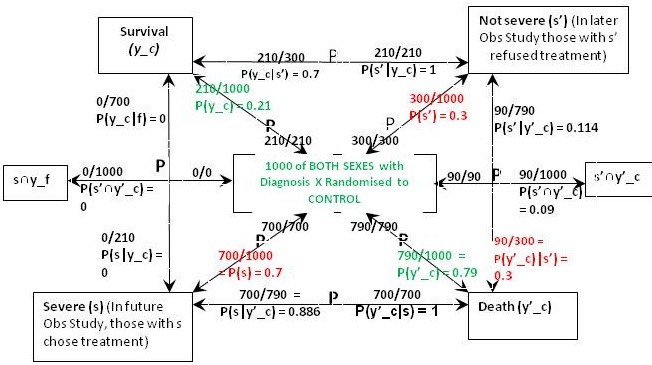
Figure 1 is what I call a ‘P Map’ that I use in my teaching and in the Oxford Handbook of Clinical Diagnosis to try to translate verbal reasoning with probabilities into mathematical symbols. The arrows represent probabilities statements e.g. in Figure 1 the top arrow from right to left states that ‘Of those with ’ Not Severe’ {s’} a proportion / probability of 210/300 = P(y_c|s’) = 0.7 lead to Survival (y_c)'. The remainder of Figure 1 represents the proportions and probabilities arising from those male and female participants who were randomised to the control (no treatment) group in the RCTs. They are represented by one figure because the results were identical for males and females.
Figure 1: The results of randomisation to control group in the RCTs on males and females

Referring to the notation in Figure 1, we know from the RCT that P(y_c) = 0.21, P(y’_c) = 0.79 (see green type). We are told from the Observational Study (see red type) that the feature (s) that prompted choosing treatment occurred in 70% of males and females so P(s) = 0.7 and P(s’) = 0.3. We are also told that the 30% frequency of death in those on no treatment in the Observational Study was the same as in the RCT, so p(y’_c|s’) = 0.3. This information so far allows us to calculate all the other probabilities and proportions in Figure1. Thus from Bayes rule, p(s’|y’)_c = 0.3x0.3/0.79 = 0.114 so that p(s|y’_c) = 1-0.114 = 0.886. From Bayes rule, p(y’_c|s) = 0.79x0.886/0.7 = 1 so that p(y_c|s) = 1 – 1 = 0.
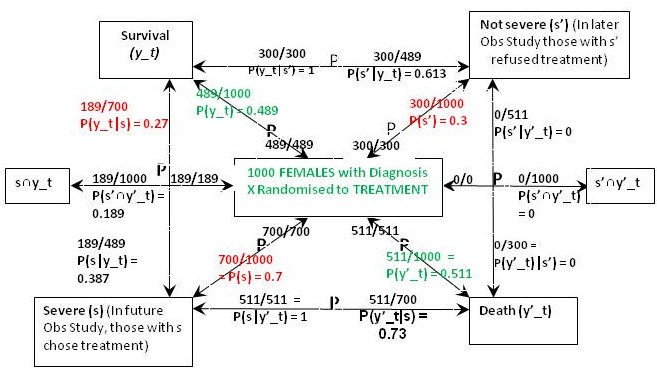
Figure 2: The results of randomisation to the treatment group in the RCT on females

The result of the RCT on females when they were randomised to treatment is shown in Figure 2. This time were told that 27% of those with the feature (s) who chose treatment in the Observational Study would have been the same in the RCT, so in the latter, P(y_t|s) = 0.27 and P(y’_t|s) = 0.73. From Bayes rule, P(s|y’_t) = 0.7x0.73/0.511 = 1 so that P(‘|y’_t) = 1 – 1 = 0 and by Bayes rule, P(s’|y’_t) = 0. This also means that P(s’∩y’_t) = 0 and from Figure 1, P(s’∩y’_c) = 0.09.If p(Benefit) = [P(s’∩y_t)-P(s’∩y_c)]+[P(s∩y_t)-P(s∩y_c)[ = [0.3-0.21]+[0.189-0]=0.09+0.189=0.279, then p(Harm) = p(Benefit)-ATE= 0.279-0.279=0.
The above results means that those with and without feature {s} benefit from treatment by more surviving (and fewer dying) on treatment than on placebo). In other words between subsets {s’∩y_t} and {s’∩y_c} and also subsets {s∩y_t} and {s∩y_c} there was only benefit from treatment and no harm so p(Harm) was zero. However in those with {s’} few (30%) die on placebo. If the treatment had an unpleasant adverse effect (e.g. brain damage with life-long mental and physical incapacity) the treatment might be refused. This is what might have happened in the observation study. However of those with the feature {s}, 100% would die without treatment so the latter subgroup would choose it in an observation study after being so advised.
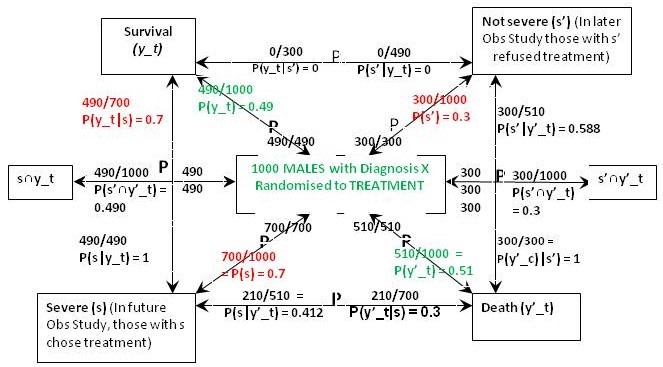
The result of the RCT on males when they were randomised to treatment is shown in Figure 3. This time were told that 70% of those with feature (s) who chose treatment in the Observational Study would have been the same in the RCT, so in the latter, P(y_t|s) = 0.7 and P(y’_t|s) = 0.3. From Bayes rule, P(s|y’_t) = 0.7x0.3/0.51 = 0.412 so that P(s‘|y’_t) = 0.588 and by Bayes rule again, P(s’|y’_t) = 0.51x0.588/0.3 = 1. This also means that P(s’∩y’_t) = 0.3*1 = 0.3 and from Figure 1, P(s’∩y’_c) = 0.09. In contrast to the female data, ‘benefit’ only occurs between {s∩y_t} and {s∩y_c} so for males if P(Benefit)=[P(s∩y_t)-P(s∩y_c)]=[0.49-0)=0.49, then p(Harm) = p(Benefit)-ATE=0.49-0.28=0.21
Figure 3: The results of randomisation to the treatment group in the RCT on males

In the case of males, the reconstructed RCT result was very surprising. Many more men (actually 100%) were dying after treatment than on no treatment when it was 30% (exactly the same as in females). This suggested that the extra deaths on treatment were due to an adverse effect. It was also clear that none of those men surviving had taken the drug but all those dying had taken it. This would have been very noticeable to those conducting the RCT and would have prompted a detailed investigation leading to a discovery of the cause (e.g. anaphylaxis or fatal failure of an organ). Those males in the observational study would therefore have been forewarned not to take the drug unless they had the feature {s}.
The optimum strategy would therefore be to treat males with the feature {s} but not to treat those without that feature (i.e. s’). This means that a total of 49% would survive with {s} and being treated and a total of 21% with s’ and no treatment would survive giving a total of 49+21 = 70% surviving. If none of the men were treated 21% would survive. If they were all treated, 49% would survive. By contrast if all the females were treated, 49% would survive compared to 21% if none were treated. If only those females with {s} were treated 18.9% would survive together with 21% of those not treated giving as total of 39.9%. This is what happened in the observation study.
The CSM or FDA might license the treatment for all females but only the males with feature {s}.


